EURUSD finally managed to break free last week from the consolidation that had persisted since early December 2015. I mentioned Wednesday’s break of confluent resistance, noting that the bullish break exposed the next level of resistance at 1.1210.
Sure enough, the pair found enough sellers at this level last Thursday to reverse prices heading into the weekend. However, Friday’s pullback looks fairly constructive, especially with prices holding above the 1.1058 handle.
From here, a close above 1.1210 would expose former channel support that extends off of the 2015 low, while a move back below 1.1058 would expose recent highs near 1.10.
At the moment, prices remain fairly extended from the mean, suggesting that we may see a return to 1.1058 before the next leg up can materialize. A pullback to this area combined with the right bullish price action could offer a favorable place to get long.
GBPUSD found a bid last week as Wednesday’s rally put the pair above the 1.4446 handle. This brings the 1.4800 level into the crosshairs this week should the bulls continue to support the recent rally.
The lack of favorable price action at the moment leaves us on the sidelines for now. Any rotation back to 1.4446 followed by bullish price action could present a compelling opportunity to get long.
On the flip side, bearish price action on a retest of 1.4800 could be a sign that the bearish trend is ready to resume and thus offer traders a chance to get short.
USDJPY remains one of my top trade ideas for 2016. However, despite last week’s selloff, the pair isn’t quite ready for prime time just yet.
That said, the recent plunge made a strong statement to anyone who thought that recent developments out of the BoJ would have a considerable, long-term impact to the Japanese yen.
I’ve said for quite some time (mostly to my members) that any additional moves by central banks to curb bearish sentiment will likely fall short of their expectations. Last week’s price action in USDJPY, which is heavily correlated to equities, is proof of this.
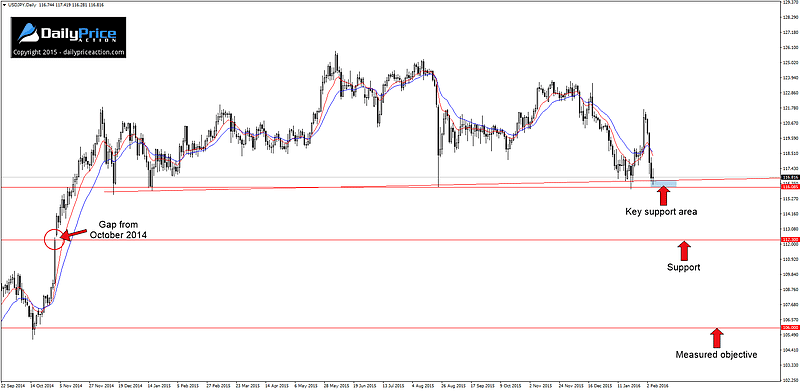
Speaking of, last week’s price action has the pair starting this week at an extremely important level for the risk-sensitive pair.
As strong as this trend line appears to be, there is a horizontal level that is also playing a role as additional support. The 116 handle has been propping up prices since the pair climbed above it on November 14th 2014.
A close below this level is needed in order to see further downside risk materialize. Such a close would first target the gap from October of 2014 near 112.30. Below that, prices could extend toward the head and shoulders 1,000-pip measured objective near 106.
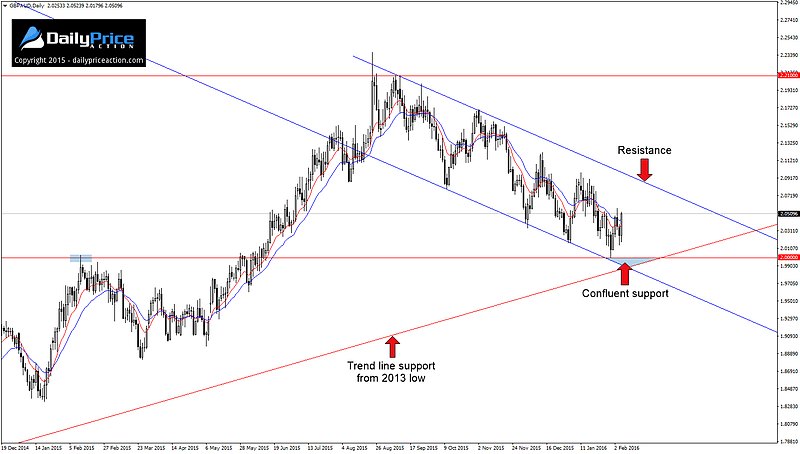
A quick refresher is in order for GBPAUD, a potential setup I mentioned two weeks ago. In fact, the annotations on the chart below are the exact same as that of the commentary from January 24th.
As you can see from the following chart, the pair retested the 2.00 handle recently. In fact, the pair only pierced this level by 5 pips before reversing higher by more than 500 pips over the next five trading days.
If you missed the initial retest, you may get a second chance at an entry but it’s going to require some patience. The descending channel that extends off of the August 2015 high looks to have primed this market for another leg up.
However, a close above channel resistance near 2.0900 is needed in order to confirm that upside potential. Such a break could eventually target the 2015 highs near 2.2100.
Last but certainly not least, we have the NZDJPY 4-hour rising wedge. I mentioned this pattern last week, just hours before sellers pushed prices below wedge support, confirming the downside potential.
Also mentioned in that commentary was the 77.60 handle, and just as I suspected, the pair found support here (albeit momentarily) before breaking lower. The very next 4-hour candle then found selling pressure at this level as the pair tested it as new resistance.
Last week’s close keeps the bearish pressure intact for the week ahead, which exposes the 75.80 area and could eventually retest trend line support off of the 2009 low. That level currently comes in near 74.30.
A daily close below this trend line would open up a much greater opportunity for the bears. As mentioned earlier this year, the NZDJPY price structure over the last seven years is frighteningly similar to that of the price action leading up to the 2008 collapse.


