The second half of 2015 may have very well set the stage for a 2016 that will offer the kind of opportunities Forex traders haven’t seen since the 2008/2009 era, and I don’t say that lightly.
While the commentary below is my opinion and my opinion only (as is all content on this site), I do feel confident in saying that the volatility in 2016 could very well rival that of the 2008 global crisis.
That doesn’t mean that I think we are facing a repeat of 2008 in recessionary terms, but it does mean that this year could produce some of the most favorable opportunities the Forex market has seen in seven years.
That said, a required ingredient to sustain such an opportunistic environment is a heightened level of volatility, and with volatility comes a greater degree of risk. This increase in risk requires that each trade setup be approached with prudent risk management as an increase in volatility can bite you just as easily as it can help you make money.
If volatility does begin to pick up (which it already has to some degree), the very first currency every Forex trader should turn to is the Japanese yen. As mentioned previously, in times of uncertainty the yen will gain strength due to its safe haven status, which is exactly what we saw transpire in the first trading week of the new year.
As such, the commentary below will focus mostly on the Japanese yen without excluding other favorable opportunities that exist or perhaps will exist as 2016 continues to unfold.
EURUSD has been a tough pair to trade in recent months. Despite last October’s short setup, which was good for more than 500 pips, there simply haven’t been many opportunities via the single currency.
I know most Forex traders love to trade the Euro versus the US dollar, and being the most liquid currency pair out there, it makes perfect sense. However, I’m a huge advocate of targeting the “low hanging fruit”, and in a similar fashion, staying away from sideways or choppy markets.
The EURUSD, in my opinion, has been just that. So while I still maintain a longer-term bearish bias on the pair, I won’t have any interest in trading it until it clears recent congestion, which won’t likely happen until sellers take out the 2015 low at 1.0460.
A move below this level would expose the 1.0210 support level, with a breach there triggering the long-awaited push to parity.
GBPUSD has really started to accelerate lower in recent weeks after spending much of 2015 range-bound. Speaking of which, the ascending channel that was carved out between April and November of last year became an excellent barometer for continued weakness as we moved into the latter half of the year.
In the latest weekly Forex forecast, I pointed out how the first trading week of 2016 managed a close below an important technical level. The 1.4565 handle, which is the 2015 low, has been on my radar for quite some time. Last Friday’s close below it exposes the 2010 low of 1.4225, a move that is already well under way at this point.
Keeping with the bearish theme, a close below the 2010 low wouldn’t likely see much in the way of buying until the 2009 low at 1.3500.
USDCHF presents one of the more obvious opportunities in 2016 in my opinion. The pair has been knocked down considerably for the better part of fifteen years, leaving it extremely “cheap”, relatively speaking.
Combine that with the ten-month wedge pattern that broke out to the upside last year, and you have an environment that is tilted in favor of buyers.
How high could it go?
My own interpretation of the current environment utilizes last year’s wedge to project a longer-term objective. I mentioned this idea last October, but it’s probably worth repeating.
The height of the ten-month wedge pattern is 1,930 pips from top to bottom. If we project that same distance starting at the October breakout, we get an objective of 1.1730, which just so happens to line up with the 2010 high.
AUDUSD should be familiar to those who have been following me for the last few weeks. As suspected, the recent break of (former) trend line support that extends off of the 2015 low at 0.6910 gave rise to additional selling pressure.
While this multi-year low has not been sufficiently tested just yet, recent price action indicates that it’s only a matter of time.
A move below that would target the 0.6800 handle, a level that acted as support and resistance during the 2008/2009 period. It also marks a prominent July 2003 high, which later became the 2004 low.
While this level should provide decent support for the pair, the descending channel that has been in place since October of 2014 hints at the idea that we could see prices extend as low as 0.6250 in the latter half of 2016.
NZDUSD, like AUDUSD, has a lot of downside potential should the bears continue to call the shots in 2016. In fact, the pair just recently confirmed my suspicions that a retest of 0.6430 and possibly 0.6240 is in the cards.
But before we talk about that, a look at the “big picture” is in order. The monthly chart below shows where the pair might be heading given the weakness that has been in place since mid-2014.
As you can see from the chart above, the trend line that extends off of the 2000/2001 lows could come into play later this year if the current trajectory is any indication.
The more immediate levels of support are just as clearly defined on the daily chart, which come in at 0.6430 and of course the 2015 lows near 0.6240. And if last week’s break is any indication, it’s only a matter of time before these levels come under pressure.
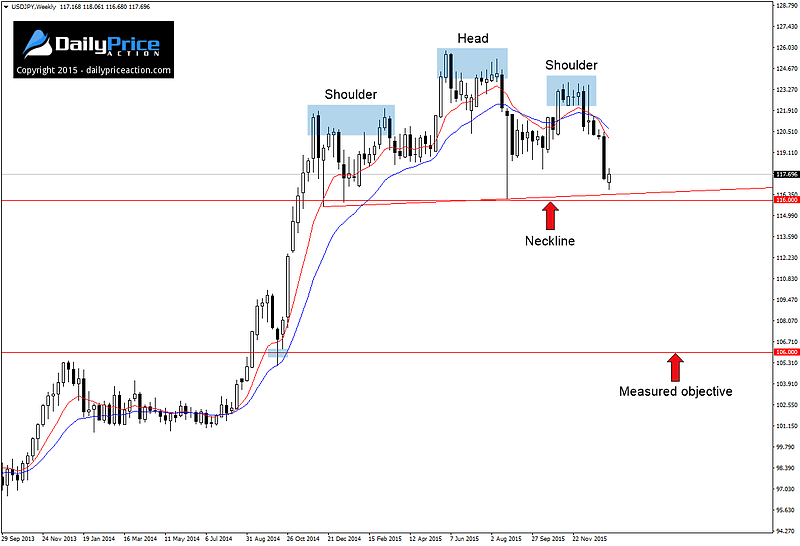
USDJPY has enjoyed a long growth spurt, perhaps too long. The combination of US dollar strength and deliberate weakness to the Japanese yen over the years has contributed to an impressive 5,000 pip rally since the 2011 low at 75.50.
During this stretch, the pair paused several times to consolidate before eventually moving higher. However, this last consolidation period that began in late 2014 has not only been the longest since 2011, it has also carved out a pattern that should give USDJPY bull cause for concern.
The weekly chart depicts what appears to be a head and shoulders pattern that spans thirteen months. A break below the neckline, which resides at 116, could trigger a 1,000 pip move lower to the objective near 106.
Such a move would reaffirm the idea that USDJPY is on the doorstep of a new multi-month (possibly multi-year) bear trend, which shouldn’t come as a surprise after more than three years of seemingly unchallenged gains.
GBPJPY certainly took its time breaking down from the fourteen-month trend line support that formed between October 2014 and December of 2015.
However, since the pair broke down on December 14th, it has been an absolute blood bath. Our shorts are now “in the green” by more than 1,300 pips, but still remain 400 pips away from our objective at 165.60.
Although I do think we could see a bid develop at the 165.60 handle, I won’t likely turn bullish here for quite some time. Only time will tell, but I do believe that last December’s break of trend line support was the start of a multi-month decline that could expose prices as low as 147 as 2016 continues to unfold.
AUDJPY has some of the best technical levels out of any pair in today’s commentary. You may remember one such level, which we traded in July of 2015.
After breaking down from seven-year channel support on July 6th, the pair consolidated for the better part of two months before eventually sliding even lower in late August of 2015.
Aside from NZDJPY, which will we discuss next, AUDJPY was one of the first yen pairs to show material weakness after breaking a multi-year pattern. However, as we eventually learned, it wouldn’t be the last.
At the moment, the pair seems to be finding a bid near the 2015 lows at 82.00. Below that the 80 handle will likely attract a few buyers with a break there targeting the 2011/2012 lows at 74.50.
NZDJPY is another currency pair at the top of my list for 2016. I personally think that this pair has huge downside potential in the weeks and months to come.
How much potential, exactly?
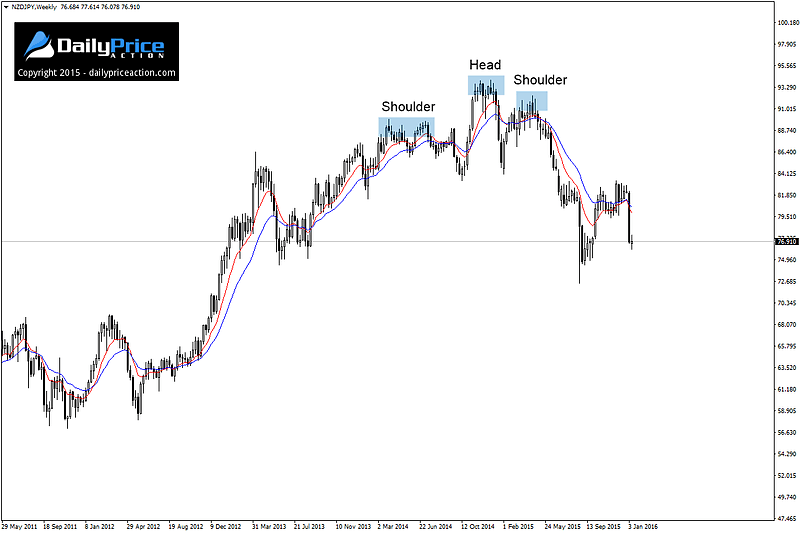
While nobody can say for sure, an eventual move toward 69, 58 or even as low as 47 cannot be ruled out. Some may argue that a decline of this magnitude is not probable, but my reasoning is the same as AUDJPY above – recent (major) topping patterns combined with larger multi-year cycles at work.
A look at the weekly chart tells the story.
If the head and shoulders pattern above isn’t enough, how about the multi-year trend line that is about to come under fire?
This level has been in place since the 2009 low. With the price action in recent weeks beginning to weigh down on this level, I wouldn’t be surprised to see a break within the next several months. Such a break would be an indication that a greater shift in bearish sentiment is beginning to take hold that could ultimately push the pair much lower throughout the course of 2016.
CADJPY is a pair I haven’t mentioned recently, but performed extremely well for us towards the end of 2015. It all started with the thirty two-month head and shoulders pattern that formed between January 2013 and August of 2015.
Following the breakdown last August, the pair carved out a rising wedge pattern on the daily chart. And while the pair has seen substantial losses since the wedge pattern broke down in late November, I do think we could see another 400 pips come off before a meaningful bid emerges.
This is due to the 1,400 pip measured objective from the aforementioned head and shoulders reversal. That objective, when measured from the breakout point, comes in at 78.50.
It should be noted that this level also lines up with several prominent lows from 2009 through 2011. In addition, we have trend line support that extends off of the 2009 low which happens to intersect with the 78.50 handle, giving us an area of confluent support.
With that said, I won’t be a buyer even after a successful retest of the 78.50 objective. The recent bearish trend combined with what I’m seeing in other yen pairs (mentioned above) will likely be enough to keep me away from the bid for quite some time.


