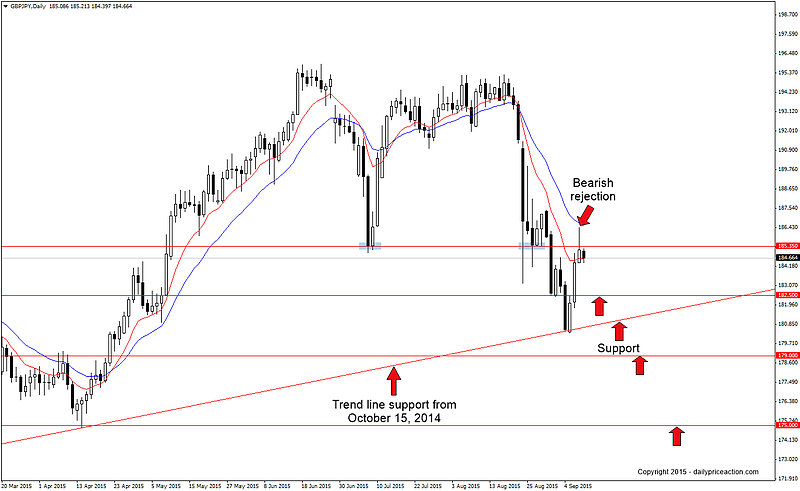
Since Monday, August 24th, much of our attention has turned to the yen crosses, and for good reason. That was the day that saw panic spread across global markets, trigger a massive selloff in the yen crosses.
As we know, the Japanese yen is treated as a safe haven currency during times of fear or panic, which means investors begin to pull their money from riskier assets and seek shelter in something like the yen.
But you don’t need an economics degree from Yale to see it or even understand its impact on the price structure of these currency pairs. A quick glance at any one of these yen crosses on one of the higher time frames will reveal its recent effects.
One pair we haven’t talked about much lately is GBPJPY. However it’s certainly worth pointing out that this pair may have formed a major top between June and August. This is of course an idea I share on most of the yen pairs at the moment due to the current risk off environment that is becoming increasingly pervasive.
What makes me think so?
My reasoning is similar to that of NZDJPY. Back in February of this year I had a strong feeling that NZDJPY had formed a major top in 2014. That idea is certainly staying true to form thus far.
In fact, not only is my reasoning similar to that of NZDJPY, it’s the exact same…
The weekly chart above shows the Fibonacci retracement levels from the 2011 low to the recent 2015 high.
So what’s the big deal, you ask?
This…
Notice how the 61.8, 50.0 and 38.2 (to some degree) line up with major swing highs or lows. I noticed the exact same thing with NZDJPY back in February when the pair was trading 1,500 pips higher than it is now.
But this isn’t altogether surprising. After all, when volatility picks up and fear begins to take hold, the correlation between these yen crosses increases. So it would make sense that GBPJPY would eventually follow in the footsteps of a pair like NZDJPY.
Could the accuracy of the Fibonacci levels above be a mere coincidence?
Of course. Anything is possible in the Forex market. But as long as all the signs point to a much lower GBPJPY, I will continue to look for selling opportunities.
One such opportunity may have materialized during yesterday’s session. After climbing 600 pips from last week’s low, the pair failed to close above the 185.35 handle, forming a bearish rejection bar.
The 185.35 level was the closing price for the July 8th and August 26th sessions and is also the 50% retracement level from the April low to the 2015 high.
Keep in mind that we have some heavy event risk for the pound starting tomorrow at 7am EST. That said, even if the pair manages to push higher this week, it wouldn’t change my longer-term bearish outlook for the pair.
Summary: Opportunity to trade yesterday’s bearish rejection bar off of the 185.35 handle. Key support comes in at 182.50 as well as the trend line off of the October 2014 low. Break that and the pair is well within reach of the 2015 lows at 175.00. Alternatively, a move above yesterday’s high would signal that further short-term gains may be in the cards.


