After a year’s worth of losses, EURUSD has finally started to gain some bullish momentum since setting a multi-year low in March. But the real question everyone is asking is, how long will it last?
The answer to that question is anyone’s guess. All we can do is use the technical clues the market is giving us at the moment. The first clue is of course the bearish engulfing pattern that formed on May 22nd. As expected this pattern led to a retest of the 1.0850 level as new support.
The second clue is the March 26 high at 1.1050. This area has yet to be tested as new resistance which means the pair stands a good chance of seeing this level in the coming week.
All in all, however, the broader picture for EURUSD is one of consolidation at the moment. And given the potential for increased volatility due to the drama in Greece I prefer to stay on the daily time frame for the time being.
Summary: Wait for a retest of 1.1050 as new resistance and watch for bearish price action. Key support comes in at 1.0850. Any immediate downside potential would be negated on a daily close above the level. Alternatively, a daily close below 1.0850 would expose the next key support level at 1.0658.
As mentioned during last week’s forecast, GBPUSD broke down from a five-week ascending channel on May 22nd. This break led to a slow drift lower last week that eventually took out the 1.5353 support level.
With this break we can now watch for a retest of the level as new resistance. Immediate support comes in at 1.5195 with a break there exposing the 1.4980 key level.
Do keep in mind that we have several high-impact news events this week for the pound including the official bank rate on Thursday (June 4th) – an event that generally causes a stir.
Summary: Watch for bearish price action on a retest of 1.5353 as resistance. Alternatively, a daily close below 1.5195 would open up the potential for a move to the next key support level at 1.4980.
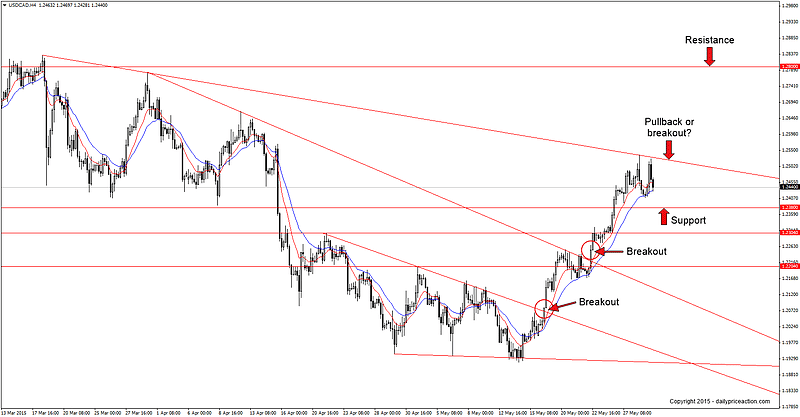
After falling below range support at 1.2380 on April 15th, USDCAD tumbled 450 pips before settling at 1.1920. All the while this move looked corrective especially considering the falling wedge pattern that had begun forming on the 4 hour chart (below).
Since that time the pair has made a habit of breaking trend line resistance. The first being the break of the falling wedge on May 18th and the second being the May 22nd breakout.
Will this week produce yet another breakout opportunity?
We will have to wait and see but one thing is for certain – I have no intention of standing in the way of the bullish momentum so long as the pair trades above 1.2304.
However even before reaching that level the 1.2380 handle is sure to put up a fight. This area represents the former range low between January and April and is also the 50% retracement from the March high to the May low.
Summary: Wait for a break of trend line resistance on a 4 hour basis. Alternatively, bullish price action on a retest of 1.2380 could present a favorable buying opportunity. A daily close below 1.2304 would negate short-term bullish momentum and expose the next support level at 1.2204.
The news calendar is packed with market-moving events for AUDUSD early in the week starting with building approvals tonight at 9:30pm EST along with a slew of key data out of China.
Things heat up even more on Tuesday with the RBA rate statement at 12:30am EST. Be extremely careful with this event as it often produces high levels of volatility.
From a technical perspective things are fairly straight-forward for the Australian dollar. Since beginning a period of consolidation in March the pair has been mostly sideways with last week showing signs of bearish continuation.
We have two key levels to keep an eye on in the upcoming week. The first is the .7750 handle which can be seen acting as resistance last week after closing below it on May 26th. Any return to this area will likely attract heavy selling pressure.
To the downside we have a critical area of support at .7550. The area represents a multi-year low for the pair and thus a break lower could open up the door for a much larger move to the downside.
Summary: Watch for bearish price action on a retest of .7750. Key support comes in at .7550. Alternatively, a daily close above .7750 would open up the potential for a move back to .7890 while a daily close below .7550 would expose the next level of support at .7410.
Last but not least is GBPCAD, a pair that was mentioned inside the Daily Price Action member’s community on Friday as one to watch.
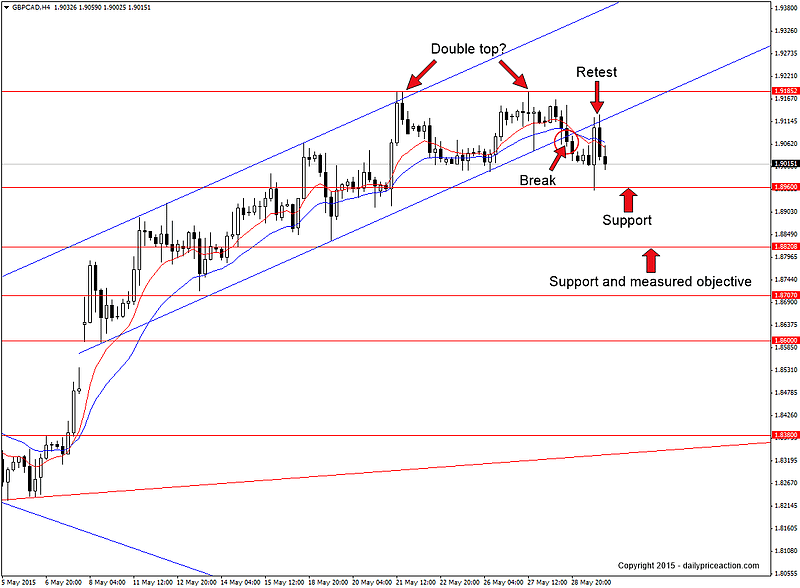
The pair has been carving out an ascending channel since breaking to the upside on May 7th. Since that time GBPCAD has enjoyed a 700 pip rally but recently failed to breach the 1.9185 resistance level on two separate occasions.
This gives us what appears to be a double top on the 4 hour chart. Of course only a 4 hour close below the neckline at 1.90 would confirm the pattern and open up the door for a push down to the measured objective at 1.8820.
However with the 1.8960 support level just 40 pips below the neckline, it may be prudent to wait for a break of this level before considering an entry. That said, the most ideal entry was perhaps the retest of former channel support during Friday’s session.
Summary: Wait for a close below 1.8960 and then watch for bearish price action on a retest as new resistance. Key support comes in at 1.8820. A close above 1.9185 would negate any downside potential.


