Of all the reversal patterns we can use in the Forex market, the rising and falling wedge patterns are two of my favorite. They can offer massive profits along with precise entries for the trader who uses patience to their advantage.
One of the great things about this type of wedge pattern is that it typically carves out levels that are easy to identify. This makes our job as price action traders that much easier not to mention profitable.
Let’s start by defining the characteristics.
Characteristics of a Wedge
The rising and falling wedge patterns are similar in nature to that of the pattern that we use with our breakout strategy. However because these wedges are directional and thus carry a bullish or bearish connotation, I figured them worthy of their own lesson.
The first thing to know about these wedges is that they often hint at a reversal in the market. Just like other wedge patterns they are formed by a period of consolidation where the bulls and bears jockey for position.
While both patterns can span any number of days, months or even years, the general rule is that the longer it takes to form, the more explosive the ensuing breakout is likely to be.
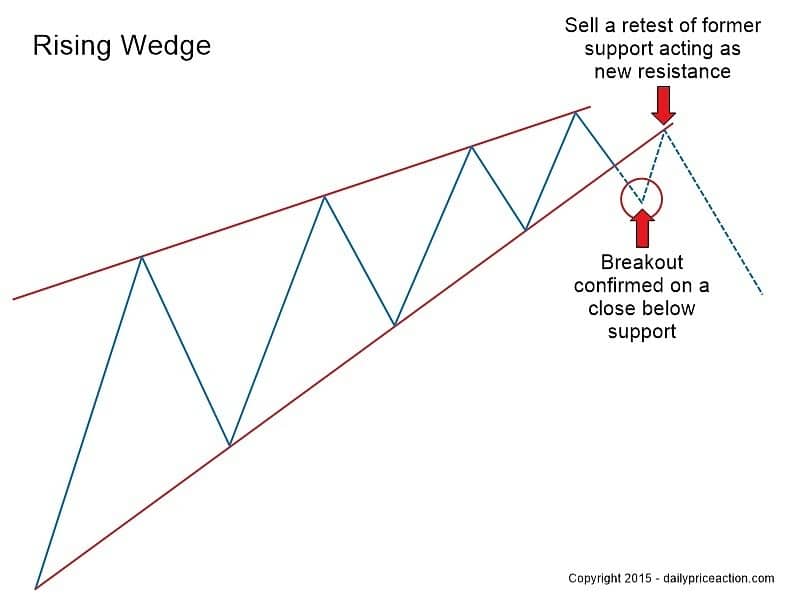
As the name implies, a rising wedge slopes upward and is most often viewed as a topping pattern where the market eventually breaks to the downside.
The illustration below shows the characteristics of the rising wedge.
Notice how the rising wedge is formed when the market begins making higher highs and higher lows. All of the highs must be in-line so that they can be connected by a trend line. The same goes for the lows. It cannot be considered a valid rising wedge if the highs and lows are not in-line.
Because the two levels are not parallel it’s considered a terminal pattern. This implies that it must eventually come to an end.
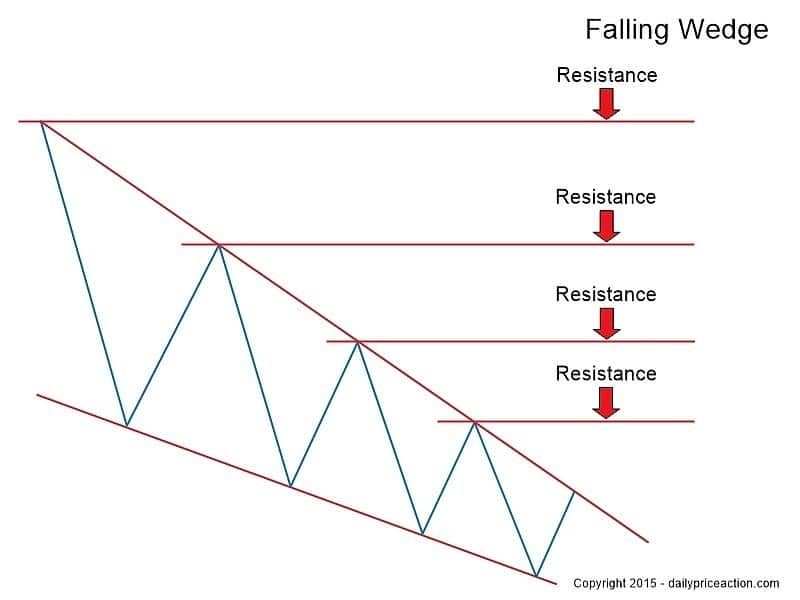
The falling wedge is the inverse of the rising wedge where the bears are in control, making lower highs and lower lows. This also means that the pattern is likely to break to the upside.
The illustration below shows the characteristics of a falling wedge.
In the illustration above, we have a consolidation period where the bears are clearly in control. We know this to be true because the market is making lower highs and lower lows.
Notice how all of the highs are in-line with one another just as the lows are in-line. If a trend line cannot be placed cleanly across both the highs and the lows of the pattern then it cannot be considered valid.
Lastly, when identifying a valid pattern to trade, it’s imperative that both sides of the wedge have three touches. In other words, the market needs to have tested support three times and resistance three times prior to breaking out. Otherwise, it cannot be considered tradable.
Trading the Breakout
Similar to the breakout strategy we use here at Daily Price Action, the trade opportunity comes when the market breaks below or above wedge support or resistance respectively.
A common question when it comes to trading breakouts is which time frame is best to use. Should we wait for a 4 hour close beyond the level or should we only consider an entry on a daily close?
The answer depends on the setup in question. It all comes down to the time frame that is respecting the levels the best.
More on that later. For now, let’s focus on how to trade the breakout. First up is the rising wedge.
Notice in the image above we are waiting for the market to close below the support level. This close confirms the pattern but only a retest of former wedge support will trigger a short entry.
Why a retest?
Put simply, waiting for a retest of the broken level will give you a more favorable risk to reward ratio.
The same holds true for a falling wedge, only this time we wait for the market to close above resistance and then watch for a retest of the level as new support.
Notice how we are once again waiting for a close beyond the pattern before considering an entry. That entry in the case of the falling wedge is on a retest of the broken resistance level which subsequently begins acting as new support.
Although the illustrations above show more of a rounded retest, there are many times when the retest of the broken level will occur immediately following the break.
Before we move on, also consider that waiting for bullish or bearish price action in the form of a pin bar adds confluence to the setup. That said, if you have an extremely well-defined pattern a simple retest of the broken level will suffice.
Stop Loss Strategies
Up to this point, we have covered how to identify the two patterns, how to confirm the breakout as well as where to look for an entry. Now let’s discuss how to manage your risk using two stop loss strategies.
Finding an appropriate place for the stop loss is a little trickier than identifying a favorable entry. This is because every wedge is unique and will, therefore, be marked by different highs and lows than that of the last pattern.
However, the golden rule still applies – always place your stop loss in an area where the setup can be considered invalidated if hit.
Let’s take a look at the most common stop loss placement when trading wedges. Below is a closeup of the rising wedge following a breakout.
Notice how the stop loss is placed above the last swing high. If our stop loss is hit at this level it means the market just made a new high and we therefore no longer want to be in this short position.
As you may have guessed, the approach to placing a stop loss for a falling wedge is very similar.
Once again our stop loss has been strategically placed. If the market hits our stop loss in the image above it means a new low has been made which would invalidate the setup.
There is one caveat here, and that is if we get bullish or bearish price action on the retest. In which case, we can place the stop loss beyond the tail of the pin bar as illustrated in the example below.
In the illustration above we have a bearish pin bar that formed after retesting former support as new resistance. This provides us with a new swing high which we can use to “hide” our stop loss.
Regardless of which stop loss strategy you choose, just remember to always place your stop at a level that would invalidate the setup if hit.
Taking Profit: It's Easier Than You Think
Now for the really fun part – taking profit. Both the rising and falling wedge make it relatively easy to identify areas of support or resistance. This is because the pattern itself is formed by a “stair step” configuration of higher highs and higher lows or lower highs and lower lows.
Let’s take a look at the rising wedge first.
Notice how we simply use the lows of each swing to identify potential areas of support. These levels provide an excellent starting point to begin identifying possible areas to take profit on a short setup.
Of course, we can use the same concept with the falling wedge where the swing highs become areas of potential resistance.
It’s important to keep in mind that although the swing lows and swing highs make for ideal places to look for support and resistance, every pattern will be different. Some key levels may line up perfectly with these lows and highs while others may deviate somewhat.
This is why learning how to draw key support and resistance levels is so important, regardless of the pattern or strategy you are trading.
A Pattern Within a Pattern
I’m going to let you in on a little secret. Both the rising and falling wedge will often lead to the formation of another common reversal pattern. You can even see the structure in the illustrations above.
Care to guess what it is?
The pattern I’m referring to is the head and shoulders. Or in the case of the example below, the inverse head and shoulders.
More often than not a break of wedge support or resistance will contribute to the formation of this second reversal pattern. This gives you a few more options when trading these in terms of how you want to approach the entry as well as the stop loss placement.
See the lesson on the head and shoulders pattern as well as the inverse head and shoulders for detailed instruction.
Taking a Page From EURUSD
To wrap up this lesson, let’s take a look at a rising wedge that formed on EURUSD. The break of this wedge eventually lead to a massive loss of more than 3,000 pips for the most heavily-traded currency pair.
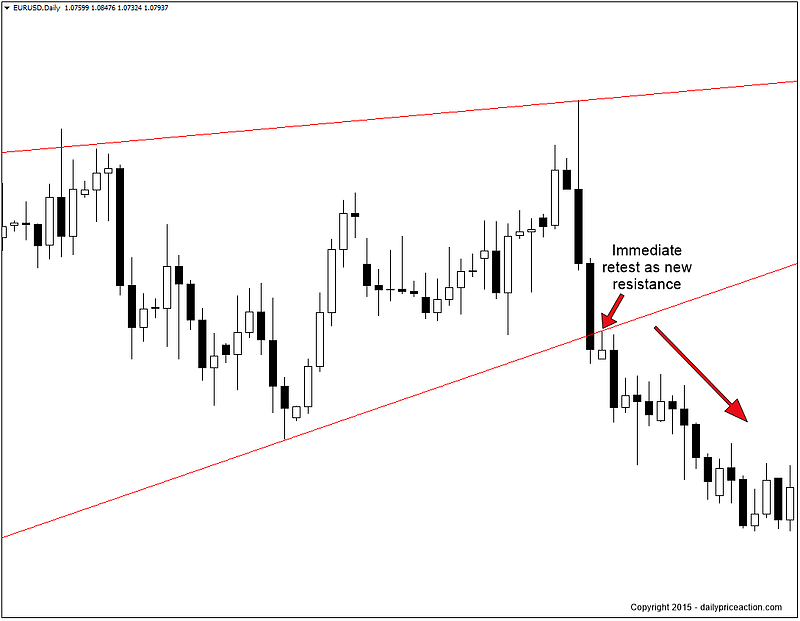
The chart above shows a large rising wedge that had formed on the EURUSD daily time frame over the course of ten months. There are two things I want to point out about this particular pattern.
1) Time Frame Matters
Remember how I mentioned that the time frame you should use depends on the time frame that is respecting both levels the best?
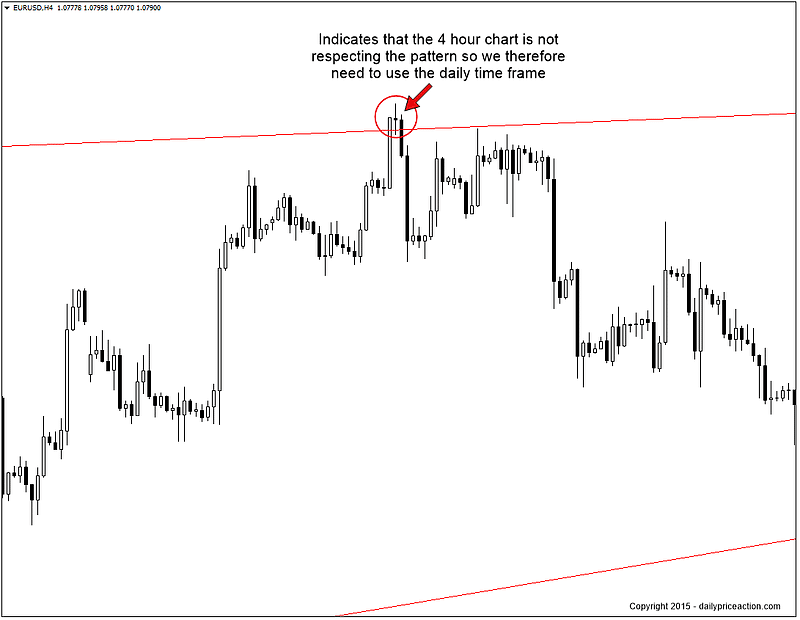
The 4-hour chart above illustrates why we need to trade this on the daily time frame. Notice how the market had broken above resistance intraday, but on the daily time frame this break simply appears as a wick.
This proves that the daily time frame is the best candidate for trading this particular wedge.
2) Immediate Retest of the Broken Level
Nine times out of ten a market will retest the broken level. However, that doesn’t always mean we will get a rounded retest.
Notice in the chart above, EURUSD immediately tested former wedge support as new resistance. This is common in a market with immense selling pressure, where the bears take control the moment support is broken.
The inverse is true for a falling wedge in a market with immense buying pressure.
In Summary
As you can see, there is no “one size fits all” when it comes to trading rising and falling wedges.
As you can see, there is no “one size fits all” when it comes to trading rising and falling wedges. However, by applying the rules and concepts above, these breakouts can be quite lucrative.
Both of these patterns can be a great way to spot reversals in the market. Like the strategies and patterns we trade, there are certain confluence factors that must be respected. The rising and falling wedge are no exception.
Below are some of the more important points to keep in mind as you begin trading these patterns on your own.
- A rising wedge is often seen as a topping pattern while a falling wedge is more often than not a bottoming pattern
- The wedge must have three touches on each side in order to be considered tradable
- The time frame used depends on the time frame that is respecting both levels the best
- The breakout is confirmed on a close below support for a rising wedge and above resistance for a falling wedge
- The entry comes on a retest of the broken level and can sometimes occur immediately without a rounded retest
- A typical stop loss strategy is to place the stop loss beyond the last swing high or low of the pattern
- Potential take profit areas are defined by the recent swing highs or lows
- Rising and falling wedges will often contribute to the formation the head and shoulders or inverse head and shoulders pattern
Frequently Asked Questions
What is a falling or descending wedge?
A falling or descending wedge is a technical pattern that narrows as price moves lower. It often signals the bottom or swing low in a market that has been trending lower.
What is a rising or ascending wedge?
A rising or ascending wedge is a technical pattern that narrows as price moves higher. It often signals the top or swing high in a market that has been trending higher.
Are wedges in Forex profitable?
Yes, wedges can be incredibly reliable and profitable in Forex if traded correctly as I explain in this blog post.
How can I trade rising and falling wedges?
First, move to the 4-hour or daily time frame. Second, find a market that has been trending higher or lower. Third, see if you can identify a wedge pattern as discussed in this post.
Your Turn
Do you currently trade rising and falling wedge patterns? If not, do you think you will start trading them having read this lesson?
Leave your comment, question or general feedback in the comments section below. I look forward to hearing from you.


