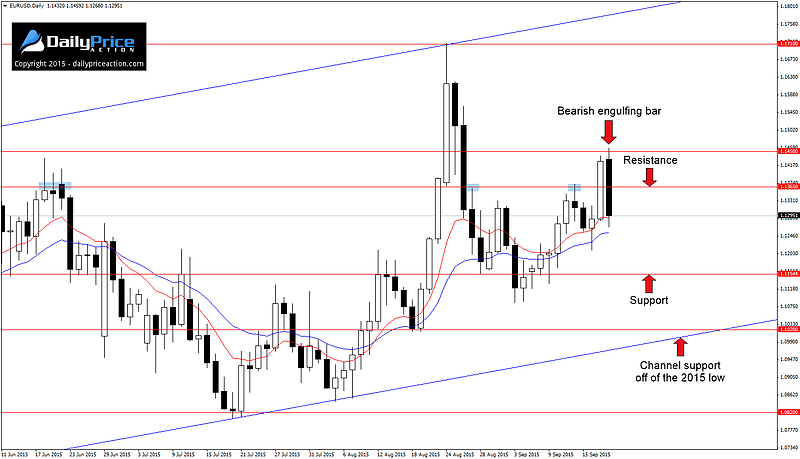
Several currency pairs found relief following the Fed’s decision to hold interest rates steady at Thursday’s FOMC meeting; EURUSD was one of those pairs.
Shortly after the decision was announced, the single currency rallied 130 pips against the US dollar. This was not surprising given the fact that a rate hold by the Fed was likely to be viewed as bearish for the US dollar, at least in the short-term.
However what was surprising to many was the price action that followed. During Friday’s session the pair gave back all of Thursday’s gains, forming a bearish engulfing bar in the process.
So it seems we are right back to square one as the pair continues to look weak below channel resistance, a price structure that has been in place since March.
It would also appear that my longer-term bias for EURUSD gets to live for another day. Although the pair is not out of this congestion pattern by any means, as long as the pair remains capped below the August high at 1.1710, my stance will remain bearish.
While the current channel does offer an 800 pip range for swing traders, the price action since March has been erratic. This alone has been enough to keep me on the sidelines over the past few months.
Summary: On the sidelines until the bears manage a daily close below channel resistance. More aggressive traders can watch for bearish price action on a retest of the 1.1365 area in the coming week. Support comes in at 1.1154 and 1.1020. Alternatively, a close above the August high at 1.1710 would negate the bearish bias and set our sights higher.
Similar to EURUSD, GBPUSD caught a massive bid after the Fed’s decision on Thursday but failed to hold those gains after the pair slammed into trend line resistance off of the May low.
I mentioned this level in a tweet on Thursday and the late-week sellers did not disappoint…
$GBPUSD just retested former trend line support from May as new resistance pic.twitter.com/Ob45wVqNav
— Justin Bennett (@JustinBennettFX) September 17, 2015
Friday’s selloff places the pound at yet another crossroads heading into the new week.
Will this be a failed attempt at a rally that results in another lower high, or will the bulls get behind this move and push the pair above the 1.5677 handle?
It’s anyone’s guess for now, but as long as the May trend line holds, I have to continue to favor the downside.
Summary: While Friday’s rejection was strong, it isn’t enough to take a short position. Instead, waiting for a close below 1.5465 may provide further confirmation that the downside pressure is here to stay. Key support below that comes in at 1.5340 and 1.5170. Alternatively, a close above 1.5677 would negate the bearish bias and turn our attention higher.
AUDUSD has not produced anything worthy of a position in quite some time, at least not for my liking. And to be honest, it still is not producing anything worthwhile.
However I wanted to highlight the current price structure because I know there has been some talk about last week’s break of trend line resistance. As such, I want to point out a few things that would be of concern for me if I were interested in a long position here.
First off, as you can see from the chart below, although the pair did break trend line resistance last week, it has failed twice to climb above the resistance area between 0.7200 and 0.7250.
This alone would be enough for me to stay on the sidelines. Now combine that bearish price action with an established twelve-month downtrend and things are not looking great for the bullish side of the argument.
What about the trend line break, you ask?
Truth is it doesn’t pique my interest due to the fact that we really only saw two solid touches off of this level. For a break to catch my attention I like to see a minimum of three obvious touches, preferably four or more.
On top of that, AUDUSD has a reputation for false breaks to the upside. The breakout on March 18th that immediately failed after punching through a seven-month trend line comes to mind.
So while there is no setup here, any ideas to go long after last week’s trend line break deserve a healthy dose of scrutiny in my opinion.
Summary: On the sidelines due to conflicting price action. Will wait for a more favorable price action setup to emerge.
EURJPY had a similar fate as EURUSD last week. Just when it looked as though the pair would rally past the 137 handle, the bears came out in force during Friday’s session, driving the pair 170 pips lower.
Last week’s false break at 137 was actually the pair’s second false break this month. The first occurred on September 4th as the pair closed the day below the 133.30 area and subsequently rallied the following week for what would become the pair’s largest one-week gain since May.
As I mentioned last week, this reputation for false breaks is keeping me away from EURJPY at the moment. The only thing that would pique my interest from here would be bearish price action on a retest of the 135 handle as new resistance.
Below that we are confronted with the 133.30 once more. Like GBPJPY, my bias remains weighted to the downside here given the recent weakness in the Euro and the risk off theme that we have seen intensify over the last several weeks.
Summary: Watch for a selling opportunity on a daily close below 135. Key support comes in at 133.30 and 131.50. Alternatively, a close above trend line resistance off of the June 9th high would expose the 138.70 resistance level.
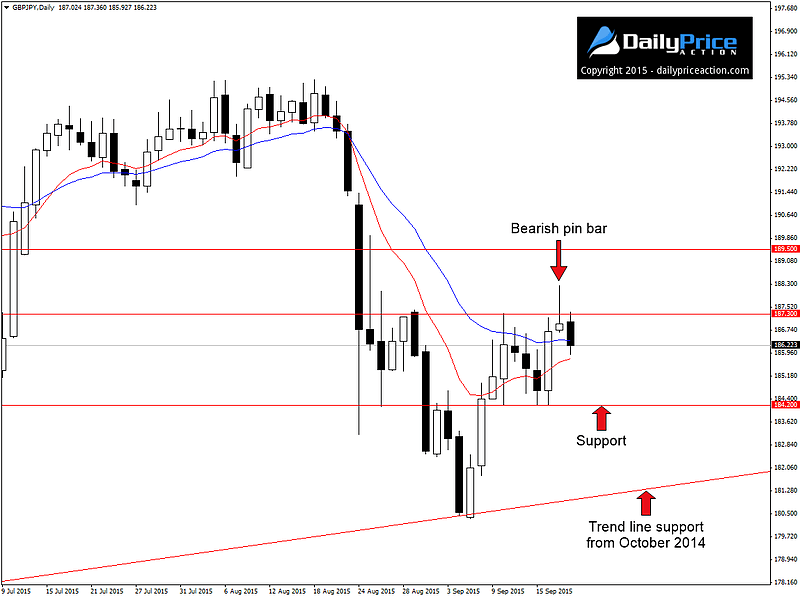
GBPJPY remains at the top of my list for the upcoming week after forming a bearish pin bar at key resistance during Thursday’s session. The bearish momentum continued into Friday’s session as the pair closed down over 80 pips.
However the bears are not out of the woods yet. They still face two key support levels this week at 184.20 as well as trend line support off of the October 2014 low.
From here traders can watch for a daily close below 184.20 as a sign of weakness that would open up the door for a retest of the eleven-month trend line.
On the flip side, a close back above 187.30 would negate the bearish bias and turn our attention to the next resistance level at 189.50.
Regardless of what happens from here, I still maintain my bearish stance so long as the current 2015 high at 195.85 remains intact. As I mentioned two weeks ago, the price structure from the 2011 low hints at the idea that a major top was carved out between June and August.
Of course only time will tell the real story, but the idea moving forward is to only look for selling opportunities while below this multi-year high.
Summary: Those who missed Thursday’s bearish pin bar can watch for a selling opportunity on a daily close below 184.20. Key support from current levels comes in at 184.20 as well as trend line support off of the October 2014 low. Alternatively, a daily close back above 187.30 would negate the bearish bias and turn our attention higher.


its just amazing…you have right in all your chart till now in this week. Good job!!!
Thanks. Glad it worked out well for you.