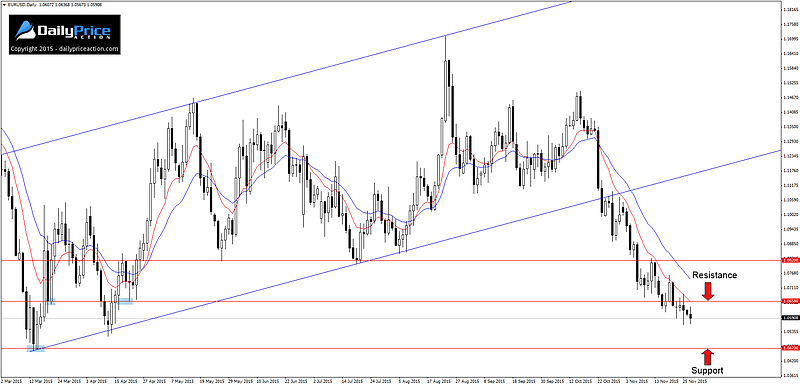
EURUSD is now down more than 400 pips since breaking below channel support on October 23rd. What’s even more significant is that the pair has cleared several key support levels along the way without much difficulty, including the 1.0820 handle.
It seems that each time the single currency tries to catch a bid, sellers are right there to knock it back down. Last week’s unsuccessful attempt to climb above 1.0658 indicates that demand is still hard to come by, even at these discounted prices.
One level that may not bend so easily, however, is the current 2015 low at 1.0470. With the pair now just 115 pips off of the level, a retest looks likely within the next few weeks.
With the year-end fast approaching, it will be interesting to see if the pair will stall out before printing fresh lows. A bounce from the current 2015 low should not be ruled out as any short covering could trigger a relief rally as we move into the last trading month of the year.
I remain short from 1.1040 with a target of 1.0470. Key resistance from current levels comes in at 1.0658 with support at 1.0470.
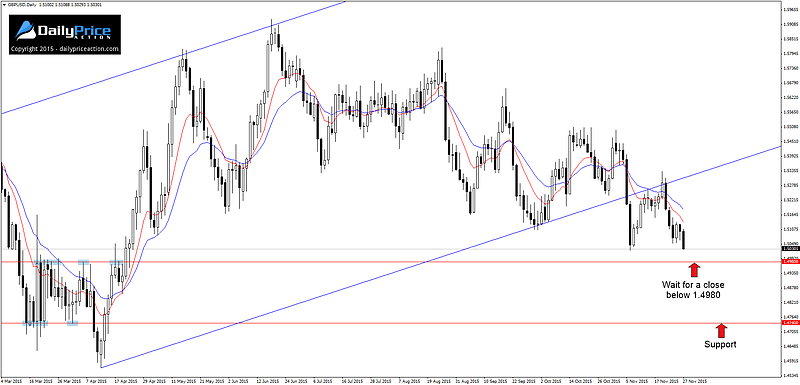
GBPUSD continues to carve out lower highs and lower lows, a pattern that has been in place since mid June. The pair now finds itself just 60 pips above a key support level that could spell trouble if it fails to hold.
The 1.4980 level previously acted as strong resistance between March and April. It should therefore attract buy orders from those with a bullish conviction in the event it is retested as new support.
However, I’m not interested in buying the pound on a retest of 1.4980. While the level may produce a bid and push prices higher, the bearish momentum that has been in place since June signals that any strength may only serve as temporary relief.
With that in mind, I’m much more interested in selling the pair on a daily close below the 1.4980 handle. This, of course, takes patience to wait for a proper setup, but with 240 pips to the next support level, it’s one worth waiting for in my opinion.
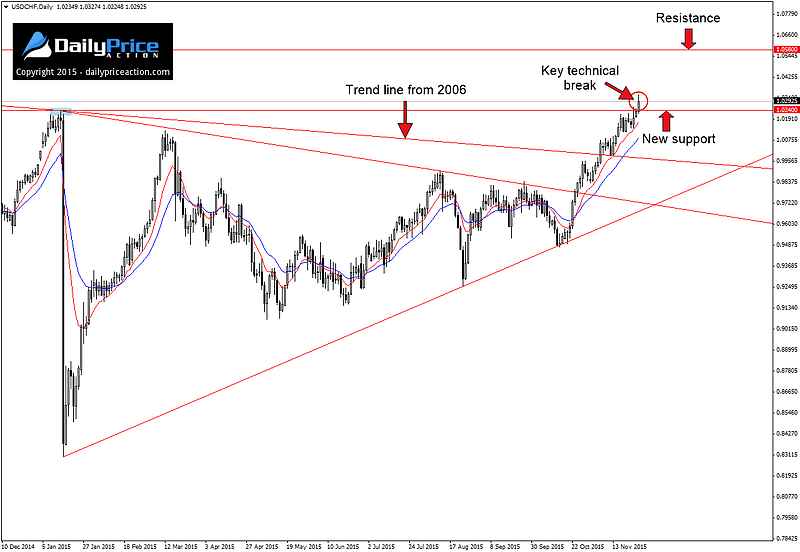
I mentioned USDCHF on Wednesday of last week, noting the potential for a break above the (then) 2015 high at 1.0240. This level had last been seen on January 14th, the day before the SNB’s actions triggered a massive 1,900 pip selloff in a single day.
Shortly thereafter, the pair began consolidating into a large wedge pattern. The subsequent breakout on October 26th has proved to be very profitable as the pair has now gained 460 pips.
Friday’s session printed fresh 2015 highs and puts the bulls in a position to push USDCHF even higher in the coming weeks and months. That said, I would like to see some healthy consolidation at current levels before the next leg higher materializes.
My bullish bias will remain intact as long as the pair remains above 1.0240 on a daily closing basis. Key resistance comes in at 1.0580 and 1.0900.
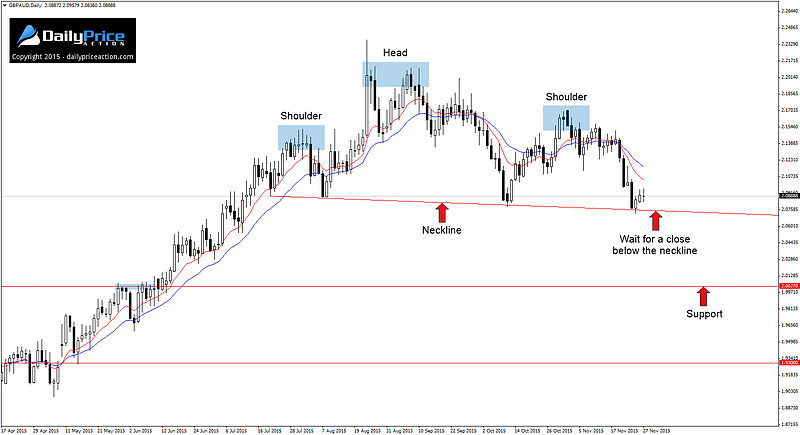
GBPAUD found a bid last week at the support level that extends off of the July 21st low. This level forms the neckline of what appears to be a four-month head and shoulders reversal.
This pattern formed after the pair rallied for more than 3,000 pips between May and August without much of a pullback along the way.
The extended nature of the pair certainly bodes well for a reversal of this sort. However, only a daily close below the neckline near 2.0740 would confirm the pattern and set up a short opportunity.
Below that, the next key level of support doesn’t come in until the May high at 2.00 with a measured objective near 1.9260.
Of course there is always the chance that this may not be a reversal pattern at all. In which case I will remain on the sidelines and continue to evaluate the price action as it unfolds.
CADJPY has been on our radar since forming the bearish pin bar on November 9th. Those who managed a 50% entry on this signal are now in profit by more than 100 pips.
That said, last week’s break could trigger a much larger decline over the next several weeks.
The wedge pattern that has been forming off of the August low at 87.33 finally broke down on Friday. This came after the pair spent several days treading water just above the key support level.
Basic technical analysis tells us that former support becomes new resistance, which is exactly what we want to see happen in the coming week.
My bearish bias will remain intact while below the three-month trend line on a daily closing basis. Key support comes in at 89 with a minor area of support near 90.55.


