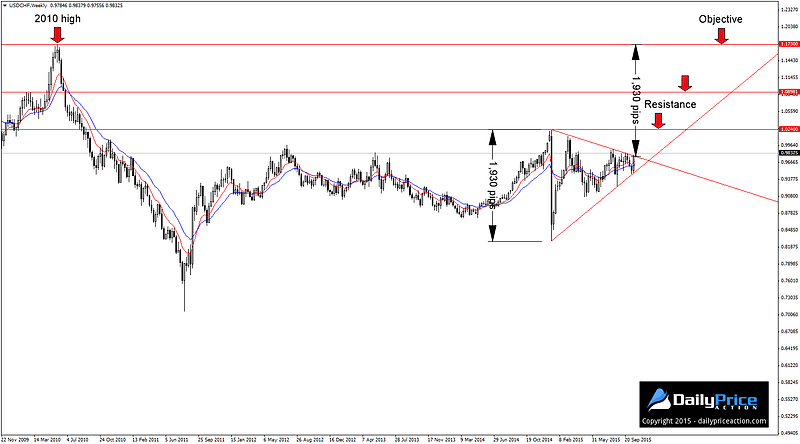
USDCHF is a pair that I rarely trade or even talk about, however the move made during yesterday’s session is certainly worth mentioning, if not trading.
The wedge pattern that has been in place since January broke during yesterday’s session as the bulls managed to close the day above resistance. The top of the wedge, which comes in at 1.0240, was the session high before the January 15th Swiss National Bank debacle.
Aside from that, this level represents a five-year high for the pair, making the wedge pattern that was derived from it that much more credible.
Speaking of credibility, both support and resistance of the wedge were tested twice before yesterday’s break. This makes the pattern tradable by my standards as I always like to have at least three touches on each side (including the starting point) before trading a breakout.
The first target for any wedge is typically the high or low of the pattern, which of course depends on whether the break is bullish or bearish in nature. In the case of USDCHF, that would make our first target the multi-year high at 1.0240.
There is also a second approach to identifying a target which involves measuring the height of the pattern in pips. That measurement is then projected from the breakout to a higher point in the market.
Because of the Swiss National Bank’s intervention back in January, the height of our pattern is a massive 1,930 pips. If we measure 1,930 pips higher from yesterday’s breakout, we get a longer-term objective of 1.1730.
That may sound lofty and possibly unrealistic, but before you cast any doubt on that objective you should know that 1.1730 lines up perfectly with the 2010 high.
Coincidence?
Perhaps, but a breakout from a ten-month pattern doesn’t happen every day. And with a 2,000 pip range, a break like the one we saw yesterday can deliver a healthy dose of follow-through if the bulls are willing and able.
The downside to this potential setup is the timing of it. With the FOMC meeting on Wednesday followed by US GDP on Thursday, things are bound to get volatile for a pair like USDCHF. Therefore any plans to trade the recent breakout should certainly take this high-level event risk into consideration.
Summary: Watch for a buying opportunity as long as the pair remains above former wedge resistance on a closing basis. Key resistance comes in at 1.0240 and 1.0900 with a longer-term objective of 1.1730. Alternatively, a daily close back below former wedge resistance would negate the bearish bias and expose wedge support near 0.9600.


