[thrive_custom_box title=”” style=”dark” type=”color” color=”#fef5c4″ border=”fadf98″]
Important: I use New York close charts. Click Here to Use My Preferred Broker
[/thrive_custom_box]
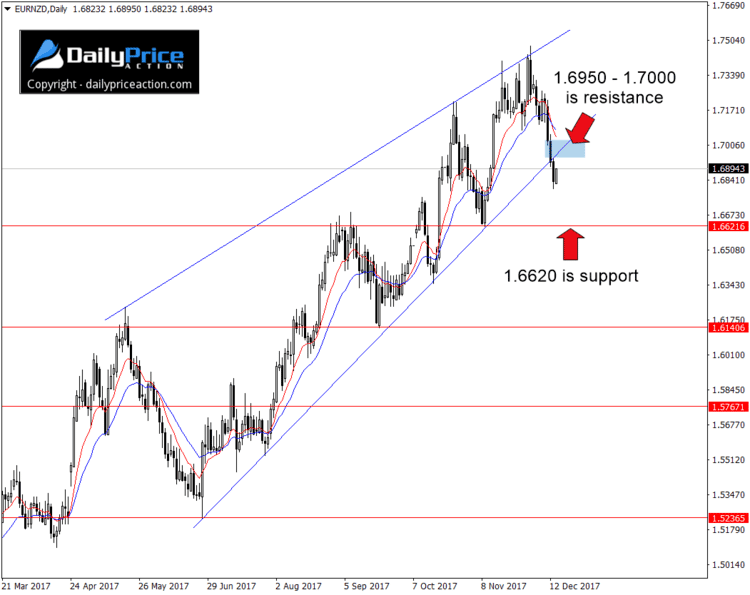
A few days ago I named a EURNZD rising wedge as my top trade idea to close out 2017. At the time the pair was trading 110 pips above wedge support near 1.6940.
Just 48 hours later, we have our breakdown. Wednesday’s 1.6832 close leaves no doubt as to whether or not sellers have cleared the trend line from the June low.
From here things are straightforward. Any retest of former wedge support as new resistance will likely encounter an influx of selling pressure. With that in mind, I will be on the lookout for selling opportunities between 1.6950 and 1.7000.
One thing I often talk about with regard to timing entries is a concept called mean reversion. It’s the idea that a market always returns to its average price.
How can we measure the average price?
I’ve found the 10 and 20 EMAs to work well on the daily time frame. If a market moves too far above or below these moving averages, I’ll stand aside. It’s a sign that prices are overextended and that a reversion to the mean is likely.
That’s what has happened to the EURNZD over the past 72 hours. The 350 pip decline has left prices overextended to the downside, which means some upward consolidation is likely.
As mentioned on Monday, the first key support area comes in at 1.6620. It’s the November low as well as the 38.2% Fibonacci retracmeent when measuring from the June low to the 2017 high. A daily close (5 pm EST) below that would expose the next key level at 1.6140.
Alternatively, a daily close back above former wedge support would negate the bearish outlook.
[thrive_custom_box title=”” style=”dark” type=”color” color=”#fef5c4″ border=”fadf98″]
Want to see how we’re trading this? Click Here to Join Justin and Save 70%
[/thrive_custom_box]


