[thrive_custom_box title=”” style=”dark” type=”color” color=”#fef5c4″ border=”fadf98″]
Important: I use New York close charts. Click Here to Use My Preferred Broker
[/thrive_custom_box]
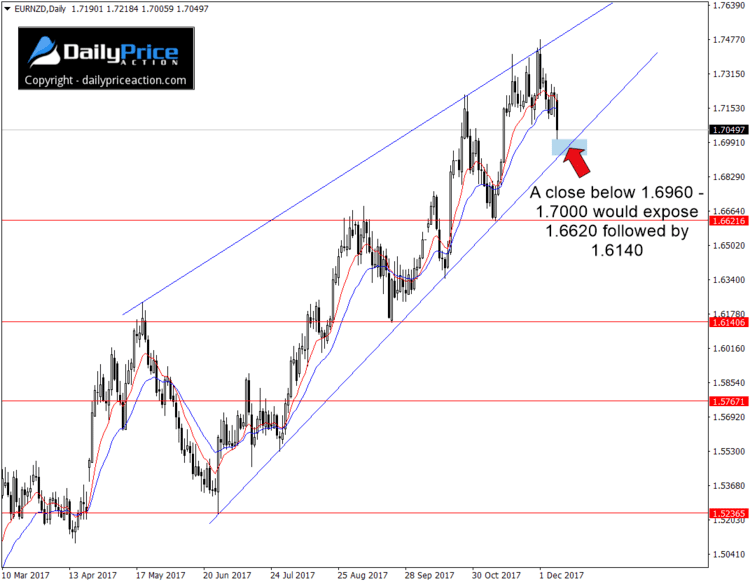
On December 6 I wrote about how the EURNZD rally could be coming to an end. At the time the pair was trading at 1.7132, approximately 200 pips above ascending wedge support from the June low.
Fast forward to today and we can see how sellers are starting to chip away at this rally. Although prices are still above wedge support, there are now less than 100 pips separating today’s price and the key support level.
Rising and falling wedges tend to act as reversal patterns. It’s a structure that signals exhaustion from either buyers or sellers. Because this is a rising wedge, we know that it’s buyers who are getting tired.
Many traders use indicators such as the RSI or MACD to look for negative divergence. It’s when a particular indicator is heading higher while the market price is moving lower or vice versa.
But when using patterns like a rising or falling wedge or even sloping flags, you don’t need those indicators. I know there’s negative divergence here; there always is during the second half of a rising or falling wedge.
Now that we know EURNZD bulls are tiring, the key is to wait for a confirmed break. That won’t happen until sellers can secure a daily close (New York 5 pm EST) below wedge support between 1.6960 and 1.7000. We should know the exact price within the next few days.
I’ve titled this post the top trade idea for 2017, but it’s anyone’s guess as to whether this structure will confirm this year or next. My guess is we’ll see a breakdown within the next couple of weeks, but anything is possible.
A daily close below support near 1.6960 – 1.7000 would expose the November low at 1.6620. A close below that would open the door to the next key support at 1.6140.
[thrive_custom_box title=”” style=”dark” type=”color” color=”#fef5c4″ border=”fadf98″]
Want to see how we’re trading this? Click Here to Join Justin and Save 70%
[/thrive_custom_box]


