It’s no secret at this point that the Yen crosses have completely sold off. I have been talking about several of these pairs over the last few weeks, namely NZDJPY and AUDJPY, both of which have seen massive moves today.
Anyone who has traded the Forex market for some time knows that the Yen crosses tend to move in tandem when volatility picks up, as it has recently. So instead of chasing markets like AUDJPY or NZDJPY, why not look to a cross that has remained relatively stable during the selloff and could therefore represent a huge opportunity should it follow suit?
The pair in question is of course EURJPY. The recent strength in the Euro has helped this pair remain buoyant in what has quickly become a risk off environment. But the million dollar question remains – how much longer can the pair hold out?
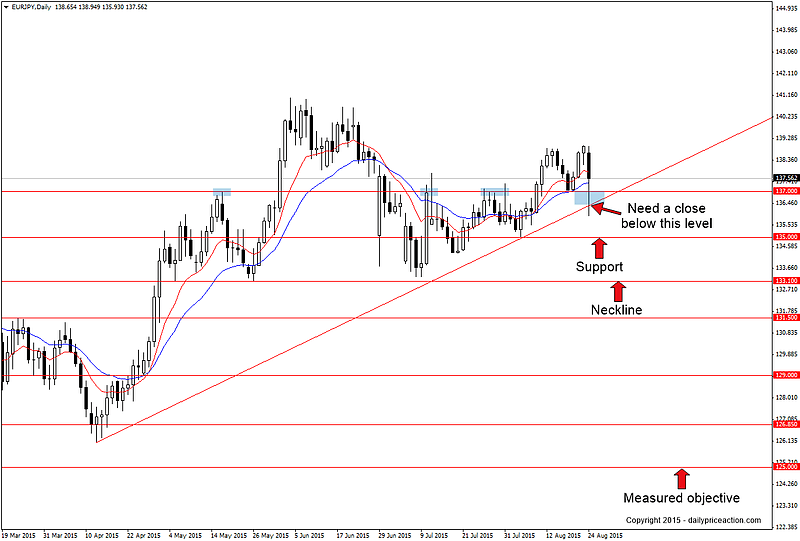
For the answer, or at least an indication of what is likely, we turn to the technicals. The head and shoulders pattern that has been forming since May has turned quite ugly, there’s no other way to say it.
However those who have followed DPA since June will recall that the fourteen-month head and shoulders pattern that formed on NZDJPY was not the best looking pattern either, yet the pair just took out the measured objective at 75.00. That marked a 1,050 pip move since breaking the neckline on June 18th. So clearly there is some room for imperfection when it comes to broader patterns such as this.
So where to from here for EURJPY?
At the time of this writing the pair is treading water above the key 137.00 level. This area intersects with trend line support off of the April low. This leaves us waiting for a daily close below both of these levels as a sign that the pair may be ready to join the rest of the Yen crosses in a move lower.
How much lower, you ask?
If the pair can crack support in the 136.30 area, a retest of 133.10 becomes likely. This level represents the neckline of the potential head and shoulders that has been forming since May, a pattern that is technically still intact as the head at 141.00 remains untarnished. Break 133.10 and the decline could accelerate over the next few weeks towards a final objective of 125.00.
Summary: Watch for a selling opportunity on a daily close below trend line support around 136.30. Key support comes in at 135.00 and 133.10 with a break there exposing 131.50, 129.00 and 126.85 with a measured objective at 125.00. Alternatively, a move above today’s high at 139.00 could send the pair to 141.00 which would negate the reversal pattern.

