EURUSD has now managed to recover 500 of the 1,000 pips it lost following the October swing high. However, despite this recent strength, the pair still remains capped below former channel support that extends off of the 2015 low.
For that reason alone, I’m not quite ready to concede that the recent strength is built to last.
That said, I believe that any weakness in the Euro may be better represented through a pair like the EURJPY. This is due to some of the price patterns we have seen develop over the past year across several of the yen pairs. More on this later.
At the moment, the 1.1020 area is acting as resistance while the 1.0820 handle should act as support if retested. Do keep in mind that a pair like the EURUSD will be highly susceptible to the volatility that Wednesday’s FOMC statement is bound to trigger.
GBPUSD is in the same boat as EURUSD. While the pair has recovered some lost ground in recent weeks, the extent to which it can rally from here depends on whether it can overcome former channel support.
Another similarity, at least in my opinion, is that any bearish sentiment toward the British pound is likely better represented through a pair like GBPJPY. The current risk-off environment should help keep the Japanese yen elevated more so than the US dollar, at least for the time being.
That said, those intent on trading this pair can watch for bearish price action at the 1.5240 area. Key support comes in at 1.4980 and 1.4740.
USDJPY continues to trade in an unusually tight range. The price action in 2015 has been limited to a range of just 1,000 pips. Compare that to the 2,100 pip range in 2014 and the 1,800 pip range in 2013 and it becomes apparent that the pair has struggled to push higher this year, relatively speaking of course.
However, the big question everyone is asking is, does this limited movement signal that the pair is running out of gas and thus, may move lower in 2016?
In my opinion, the answer is, yes. At least that is the most likely scenario.
Perhaps the range alone doesn’t offer enough evidence to claim that a major top is in place, but the technical pattern that is forming on the weekly chart is certainly enough to at least consider it as a possible outcome.
As Forex traders, it’s important to occasionally take a step back and identify any commonalities that may have presented themselves across the market.
Which commonalities am I referring to, exactly?
In the case of USDJPY, the price action that has unfolded on several other yen pairs can be extremely telling about the future of the US dollar versus the Japanese yen.
For the sake of time, I will only reference the reversal patterns that have already confirmed on NZDJPY, AUDJPY and CADJPY (below). Combine those with the potential topping pattern on GBPJPY and you have a specific set of correlations that become extremely difficult to pass as pure coincidence.
As for USDJPY, I personally don’t like the potential here until the pair clears the range floor near 116.50. A close below this level would open up the potential for a 1,000 pip move toward the 106.25 handle, an area that just so happens to line up with the 38.2 Fibonacci level from the 2011 low to the 2015 high.
AUDUSD has been gradually losing ground for more than 4 years now. In fact, the last time the pair made a higher high on the weekly time frame was in July of 2011.
And judging by the price action of late, there doesn’t appear to be an end in sight. The descending channel that extends off of the October 2014 high just recently rejected another attempted rally during the first week of December.
I like AUDUSD lower as long as this channel remains intact. As for what might trigger the next leg down, the trend line that extends off of the September low looks like a prime candidate. A close below this level should certainly attract an increase in selling pressure.
Below that, key support comes in at 0.6910. Break that and there isn’t much standing in the way until the 0.6350 handle.
AUDJPY lost the most ground last week since the late August selloff that sent all yen pairs into a tailspin.
The pair continues to carve out a well-defined ascending channel on the daily time frame. However, last week’s price action produced a trend line break that signals a retest of channel support is likely in the coming sessions.
The retest of former channel support that extends off of the September 29th low was enough for me to take a short position from 88.70.
While the channel support near 85.50 or even the current 2015 low at 82 would make favorable targets, I prefer to use AUDJPY as a way to take advantage of any intensification of the current risk-off environment.
As such, I like a move toward the 2012 low near 74.50 over the coming weeks and months. In fact, given the range over the last 20 years, I wouldn’t be surprised to see a move as low as 55.50 within the next couple years.
My bearish bias will remain intact as long as the pair trades below channel resistance on a closing basis. Immediate support can be found at 82 and 80.
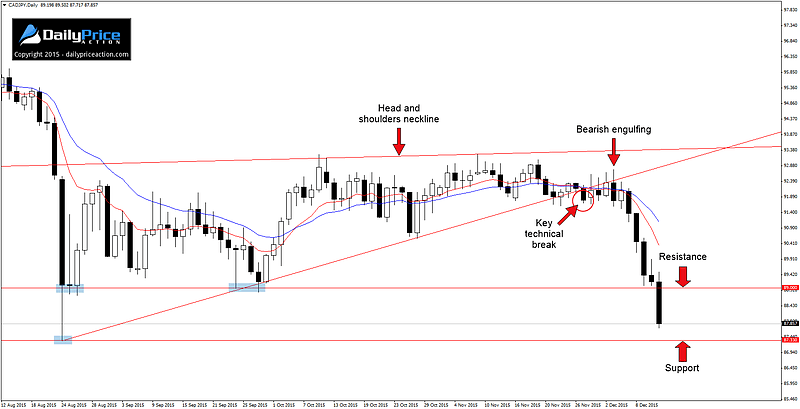
CADJPY performed perfectly for us last week. The November 27th break of wedge support followed by the December 3rd bearish engulfing pattern was reason enough for us to take a short entry with an initial target of 89.00.
The target was reached in short order last week as sellers pushed prices below the 89 handle before the weekend. This, of course, now becomes resistance in the week ahead.
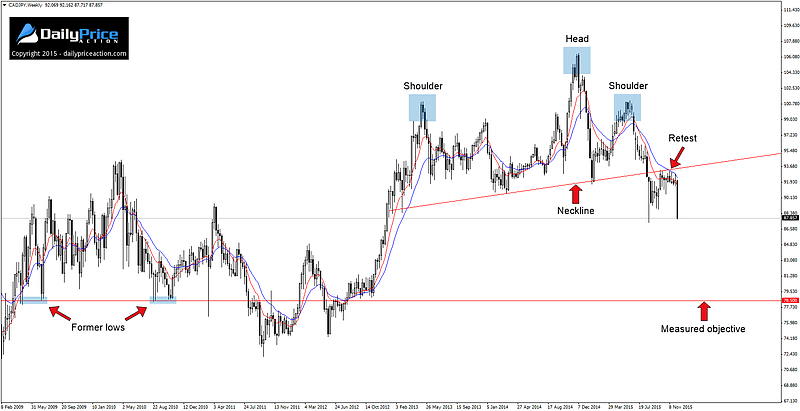
I still maintain the idea that the price action since early 2013 is a major topping pattern in the form of a head and shoulders reversal. If this plays out accordingly, traders can look for a move as low as 78.50 over the coming months.
The weekly chart below illustrates the pattern well.
It may seem unlikely that a target of this magnitude can be found using a simple chart pattern. However, I noted in a recent lesson that a measured objective which lines up with former swing highs or highs can be much more telling than one that does not.
Notice how the objective in the weekly chart above lines up perfectly with former swing lows from 2009 and 2010. While this could be a mere coincidence, my experience has taught me that confluence of this sort isn’t often without a casual connection.
From here traders can watch for a close below the 2015 low at 87.33 to signal that further weakness is likely. An alternate approach is to wait for bearish price action on a retest of the 89 handle as new resistance.


sir,it’s a very effective weekly forecast. still i try to learn about your articles and trading tips.I’m very glade to you.
I’ve a asked to you,in NZDJPY payer daily chart i see a bearish engulfing bar. is it valid?
Ashakar, not while it’s above the trend line that extends off of the Aug. 24th low.
I don’t think ashakar it is a valid BEB… as it is formed out of key levels!!!!!
Namaste>>