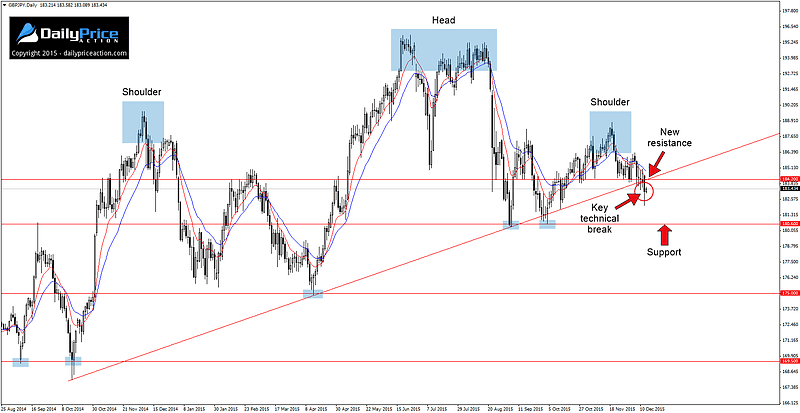
After more than three months since my initial coverage of this topping pattern, it has finally happened – GBPJPY has broken below a trend line that dates back to October of last year.
There is no doubt as to whether this level carries weight from a technical perspective. Before yesterday’s break, the pair had tested it as support on five separate occasions, each time it gave rise to higher prices.
However, the dynamics changed following the late August selloff. Instead of making higher highs, the bulls seemed to struggle just to keep their head above water. With each rally running into more selling pressure than the last, an eventual move lower seemed the more likely scenario.
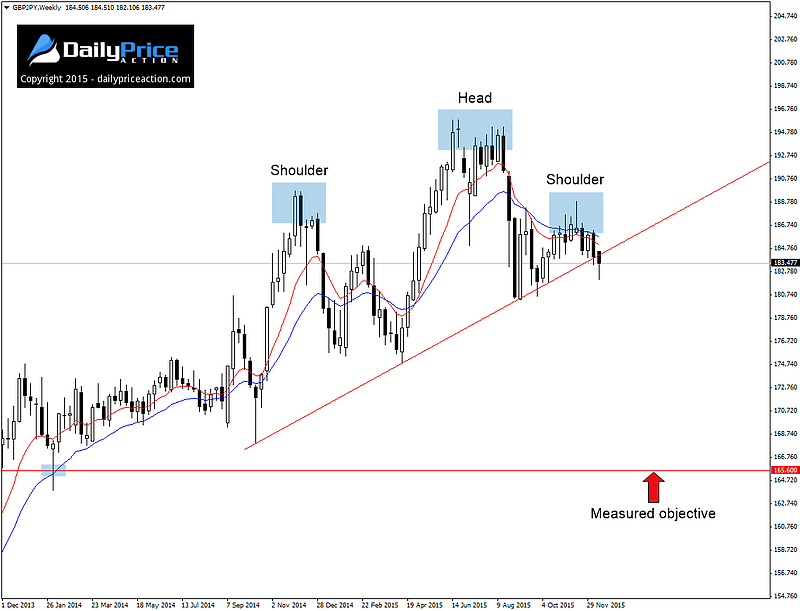
Speaking of a lower high, a quick glance at the weekly chart shows what appears to be a fourteen-month head and shoulders pattern. With this structure now confirmed, we could be looking at the potential for a 1,700 pip move to the measured objective near 165.60.
What is interesting about the objective in the chart above is that it lines up with the 23.6 Fibonacci level from the 2011 low to the 2015 high. There is also a large weekly pin bar that had formed in this general area, signaling that it is indeed a key event area.
But before you rush off to sell GBPJPY, keep in mind that the much-anticipated FOMC rate statement is less than 48 hours away. This Wednesday’s event is sure to produce heavy volatility along with liquidity concerns that will only help to exacerbate any resulting price movement.
Personally, I would also like to see a retest of former trend line support as new resistance before pulling the trigger on a short position. This would allow for a more favorable risk to reward ratio.
With all of that in mind, it may be prudent to wait until Wednesday’s FOMC is behind us before considering an entry. Key support comes in at 180.60, 175 and 169.50 with a measured objective at 165.60.


