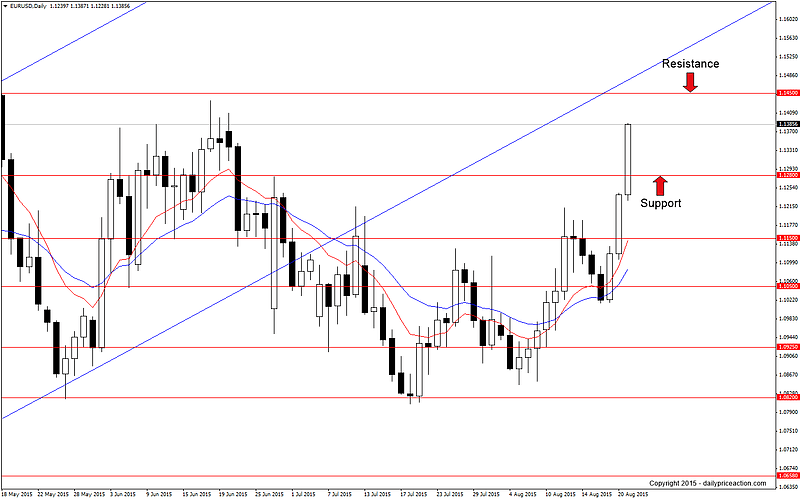
EURUSD ended last week in breakout fashion. After losing 100 pips between Monday and Tuesday, the pair managed to find buyers to end the week in positive territory by 270 pips.
The market is far too extended at current levels to consider an entry. That said, a retrace to the 1.1280 level might trigger renewed interest for buyers of the single currency.
On the flip side, the 1.1450 level should act as resistance along with former channel support from the April low, which is now acting as resistance.
Summary: Watch for bullish price action on a retest of 1.1280 as new support. Key resistance comes in at 1.1450 and former channel support, now resistance.
After breaking wedge resistance on August 12th, GBPUSD rallied 90 pips to retest key horizontal resistance at 1.5680. It now appears that the pair has broken this level and carved out a bullish pin bar in the process.
That said, I won’t be trading this due to the uncertainty of where the “true” level of value lines up. While the 1.5680 level looks fairly well defined, it is still somewhat subjective and could be drawn as high as 1.5690, which would leave the pound capped below resistance.
The key to becoming a successful Forex trader is to only take the obvious setups – the easy money. This is not an obvious setup as the market is still fairly choppy and the key level is too subjective to label the pair as a breakout candidate.
Summary: On the sidelines for now. A daily close well above the 1.5690 area could set up a buying opportunity on a retest of the area as new support. Key resistance comes in at 1.5814 and 1.5930. Alternatively, a close back below former wedge resistance, now support, would negate the bullish bias and have us looking lower.
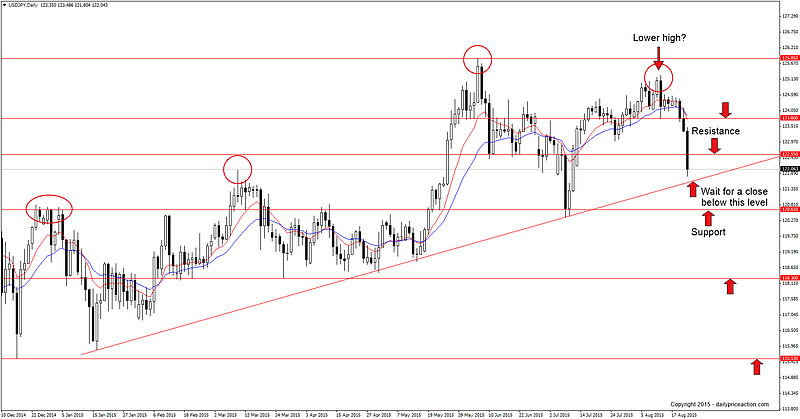
It seems like ages since I last wrote about USDJPY, mostly due to the fact that it hasn’t been very active so far this year. The choppy, sideways price action that has been in place since January has kept me away, but something tells me that may be about to change.
The level on everyone’s radar at the moment is the trend line support that extends off of the 2015 low. A break here would be significant as it would mark a potential lower low after recently forming what appears to be the first major lower high for the year.
From here traders can watch for a daily close below trend line support. Such a break would expose the 120.65 level and possibly the February and March lows at 118.30.
That said, just remember that any short setup here is technically counter-trend. This makes waiting for the daily close below trend line support along with a retest as new resistance extremely important.
Summary: Wait for a daily close below trend line support and then watch for a retest as new resistance. Key support comes in at 120.65 and 118.30. Alternatively, a bounce from the trend line would have us standing aside for now.
After losing more than 700 pips between June and July, NZDJPY has been consolidating in sideways price action that has recently started to form a wedge. A wedge pattern is typically viewed as a continuation pattern, which for NZDJPY would mean a continuation of the downtrend that began in April.
However I still believe that a better, more convincing signal that the downtrend remains healthy would be a daily close below 80.45. This level can be seen acting as support and resistance in 2013 and is also the current 2015 low.
I remain short from 91.70 and will add to my position on a close below 80.45. Below that the 79.30 level should act as support, although the measured objective at 75.00 is still in play from the larger head and shoulders pattern.
Summary: Traders can look for selling opportunities on a 4 hour break below wedge support and/or a daily close below 80.45. Key support comes in at 79.30 and 78.50 with a long-term measured objective at 75.00. Alternatively, a 4 hour close above wedge resistance would keep us on the sidelines to wait for a more favorable selling opportunity.
After three unsuccessful attempts to break the 2.4020 level, GBPNZD has retreated back below the 2.3620 level and has also broken trend line support that extends off of the July 10th low.
However I’m not considering this as a breakout opportunity as I would rather see a daily close below 2.3155 before even considering a short position. Such a close would signal a range break and also mark the first significant lower low since April.
Be sure to take your time with this one and allow something favorable to set up before pulling the trigger. Even though GBPNZD may look overextended after running for more than 4,700 pips in just three months, it doesn’t mean that the pair must correct within a specified period of time.
Summary: Wait for a daily close below 2.3155 and then watch for a selling opportunity on a retest of the level as new resistance. Key support comes in at 2.2700 with a final objective of 2.2300. Alternatively, a daily close above 2.4020 would significantly reduce the chance of an immediate correction and would likely reignite the bull market.


