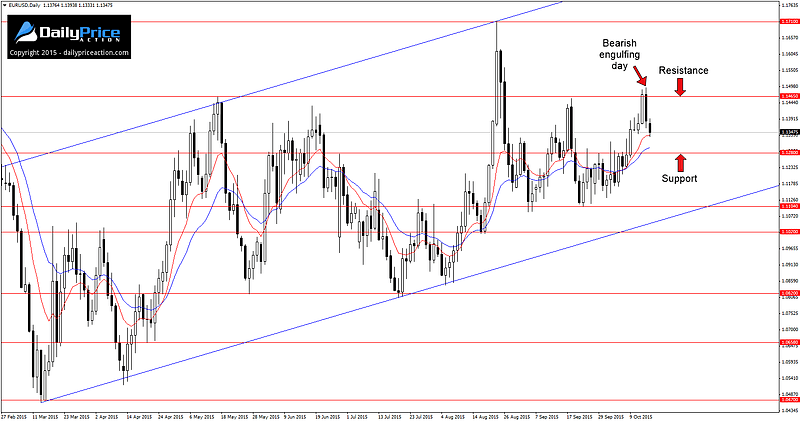
EURUSD started off last week strong with a 130 pip rally, however things quickly turned south during Thursday’s session as the pair carved out a bearish engulfing pattern on the daily chart.
By the end of Friday’s session, the bears had wiped out the early-week gains and then some. The price structure on the weekly chart tells the story, which shows a bearish pin bar off of the 1.1465 area, a level that has rejected advances in February, May, September, and now October.
While the price action inside of the ascending channel that began in March may provide favorable opportunities, I still prefer the idea of waiting for a break from this congestion zone. Such a break could signal the continuation of the downtrend that began in May of 2014.
The only thing that would negate that idea would be a close above channel resistance. Until that time I have to favor the downside, a bias that would only materialize into an outright position on a close below channel support, which currently resides at 1.1100.
Summary: Watch for bearish price action on a close below channel support. More aggressive traders can watch for an opportunity as the pair approaches support at 1.1280 or a return to last week’s resistance at 1.1465.
GBPUSD put in an impressive performance to start last week, rallying more than 300 pips from the low. However the rally stalled on Thursday as the pair ran into a wall of resistance at 1.5475.
This theme continued into Friday’s session as the bulls were unable to maintain the intraday rally that saw a high of 1.5485, closing the day 50 pips lower at 1.5435.
At first glance the recent price structure looks fairly straightforward and something that might offer up a favorable opportunity in the days ahead.
While I won’t dismiss this idea entirely, I will approach any valid setup from here with caution. The back-to-back false breaks at 1.5170 and 1.5330 suggest a level of uncertainty in the market that is not conducive to producing favorable setups, at least for the time being.
Summary: Watch for bearish price action at 1.5475. Key support comes in at 1.5330 and 1.5170. Alternatively, a daily close above the 1.5475 handle would expose the next key resistance level at 1.5657.
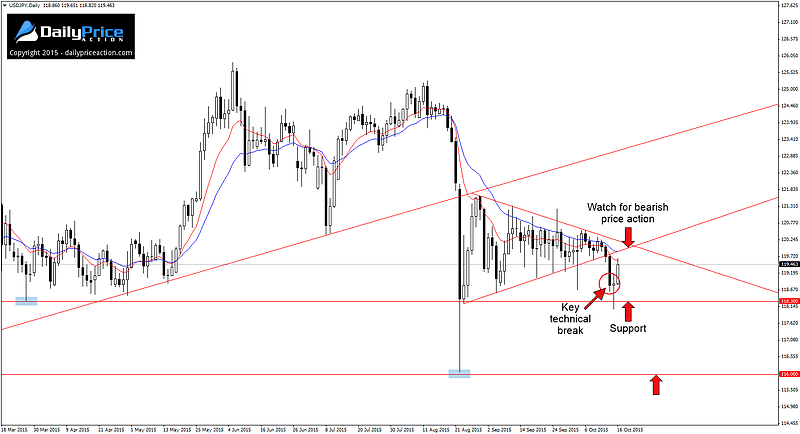
USDJPY managed to reclaim some lost ground at the end of last week after breaking below wedge support on October 14th. The 118.30 level was mentioned in Thursday’s commentary as one to watch, and sure enough the pair caught a bid at this level halfway through Thursday’s session.
The late-week rebound places the pair just 40 pips below former support, new resistance. However given the volatility of late, bearish price action from this area is preferred before giving serious consideration to a short position.
If no such price action materializes, a daily close below 118.30 could also offer a favorable opportunity to get short. In this case the August low at 116 would be the next key support level to keep an eye on.
Summary: Watch for bearish price action on a retest of former wedge support as new resistance. If nothing favorable materializes, wait for a daily close below 118.30 before considering a short opportunity. Key support below there comes in at 116. Alternatively, a daily close above wedge resistance at 120 would negate the bearish bias.
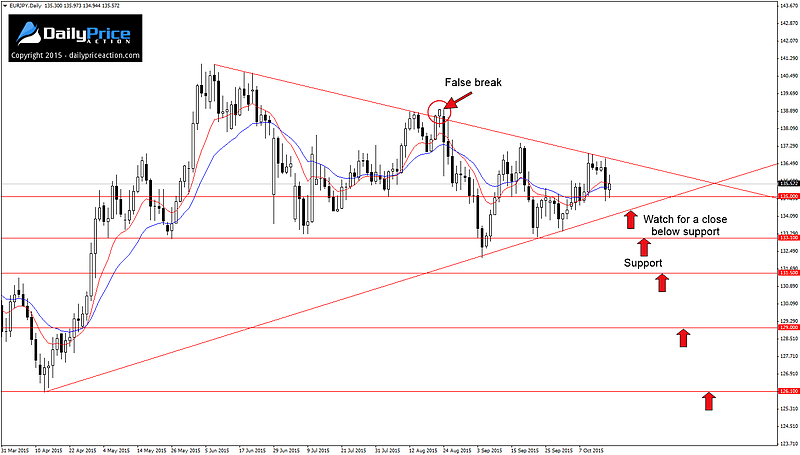
EURJPY continues to oscillate within this five-month wedge pattern. The pair recently retested resistance for the fifth time since the June 9th high and looks poised to retest support in the week ahead.
While there is always the chance that this wedge could break to the upside, I simply can’t get behind a EURJPY long given the correlation between yen crosses lately. As such, a break of resistance would keep me on the sidelines due to skepticism regarding the amount of follow-through such a break would garner.
Either way, we should have our answer within the next few weeks as this terminal pattern comes to an end.
Summary: Watch for bearish price action on a close below wedge support. From there, key support comes in at 133.10, 131.50 and 129. Alternatively, a close above wedge resistance would negate the bearish bias and turn our attention higher.
While it is certainly not the cleanest head and shoulders I have ever seen, CADJPY does appear to have carved out a reversal pattern since coming off of the 2013 lows at 88.30.
Some may call this an extended or elongated reversal pattern, very similar to the head and shoulders that formed on NZDJPY between February of 2014 and June of 2015. That particular structure performed extremely well, hitting the 1,000 pip measured objective on August 24th.
Will CADJPY do the same?
That is anyone’s guess. However a similar idea will be kept alive so long as the pair holds below former neckline support on a closing basis. If the idea begins to materialize, traders can watch for a measured move toward the objective at 78.50.
From here traders can watch for bearish price action on a retest of support-turned-resistance around 93.20. We already witnessed selling pressure in this area between October 9th and 12th.
Summary: Watch for bearish price action on a retest of former neckline support as new resistance. Key support comes in at 89 and 87.30. Alternatively, a daily close above trend line resistance would negate the bearish bias and expose the next resistance level at 94.


