EURUSD made an impressive move higher during Friday’s session following a disappointing NFP figure, retesting the highs from the 24th and 29th of September. However the rally was short-lived as sellers quickly pushed the pair 100 pips lower before the close.
Once again, this leaves the single currency in uncertain territory as it continues to tread water less than 200 pips above channel support from the March low.
At this point it seems that it’s going to take a major catalyst to move the pair out of this range that has been in place for seven months. Until that time, the directionless price action makes an entry here unfavorable.
In the bigger picture, nothing has changed the idea that the pair has been carving out a massive bear flag pattern after plummeting 3,500 pips between May of 2014 and March of 2015. Such a pattern, if confirmed, could open up another multi-month decline toward the 2000 low of 0.8225.
That said, nothing is confirmed as long as the EURUSD remains in this ascending channel, leaving traders waiting for a break, one way or the other.
Summary: Wait for a close below channel support that extends off of the March low. From there, key support comes in at 1.0820 and 1.0658. This pattern is only negated on a close above channel resistance.
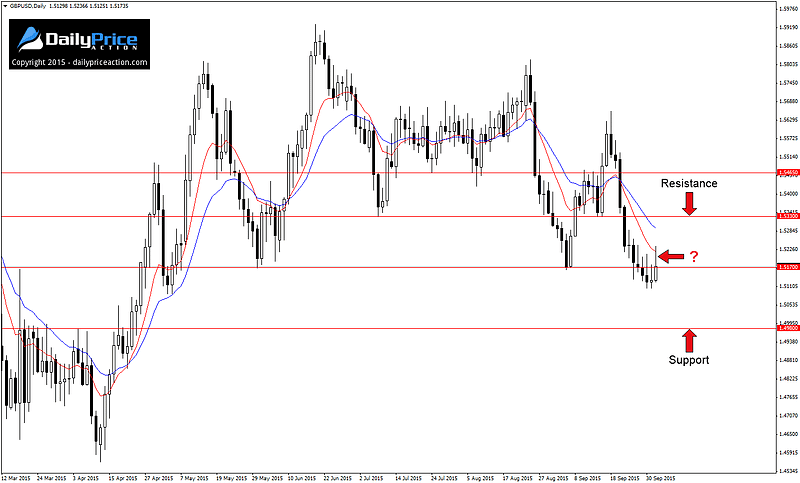
There was little to talk about last week in terms of favorable price action after GBPUSD made a significant break below key support at 1.5170. The bears were unable to gain any real momentum following this break, which allowed the bulls to advance the pair higher to end the week.
Friday’s close doesn’t give us much to work with either as things were left with an “unfinished” look and feel. At this point it is unclear as to whether the 1.5170 key level will come through as new resistance in the week ahead or fail to cap a second advance by the bulls.
As such, I’m inclined to stand aside and wait for a favorable opportunity to present itself. That opportunity could come on a retest of 1.5330 or bearish price action below 1.5170, showing that the level will indeed hold as new resistance.
Below that we have a level that acted as strong resistance between March and April at 1.4980. This level is sure to attract buyers if retested as new support.
Summary: Wait for bearish price action on a move back to 1.5330 or something more convincing below 1.5170. A move below that would expose the next key support at 1.4980. Alternatively, a daily close above 1.5330 would negate the bearish bias in the short-term and expose the 1.5465 key level.
As a trader, it’s always reassuring when you have key technical breaks across multiple currency pairs with the same quote currency. One such pair is USDCAD, which experienced a key break last week along with GBPCAD and AUDCAD, two pairs we will discuss momentarily.
Friday’s session marked a significant turning point for the US dollar versus the Canadian dollar as the pair closed below former wedge resistance from August 25th. This trend line later acted as support on September 22nd and October 1st before breaking down once again at the end of last week.
Basic technical analysis tells us that this level should now act as resistance once again. As such, traders can watch for bearish price action on a retest of the level as new resistance. Of course a daily close above the level would negate the bearish bias and turn our attention back to the 1.3350 horizontal level.
An important note here is that the 1.3050 support area is just 90 pips from Friday’s close, making it critically important to see a retest of former wedge resistance before considering an entry. This would allow for a more favorable risk to reward ratio.
Summary: Watch for bearish price action on a retest of former wedge resistance at 1.3210. Key support comes in at 1.3050 and 1.2860. Alternatively, a daily close back above the trend line would negate the bearish bias and turn our attention higher.
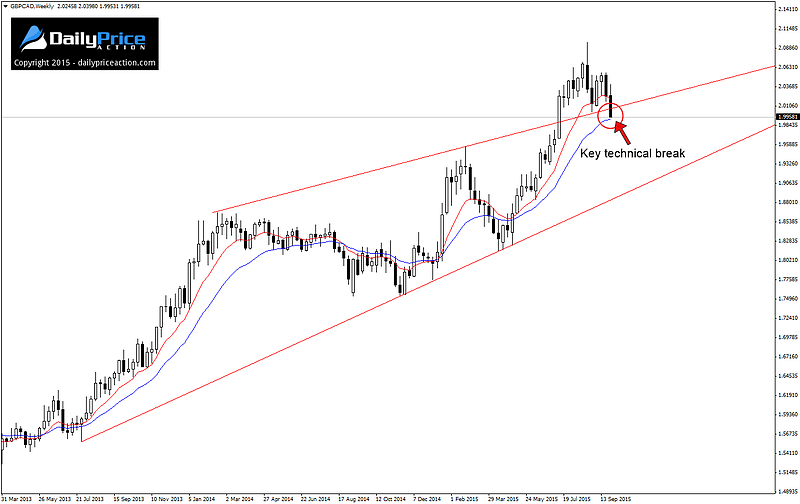
GBPCAD is another Canadian dollar pair that experienced a selloff toward the end of the week. Truth is, the first half of Friday’s session was controlled by the bulls, however that all changed when the pair ran into support-turned-resistance that extends off of the February 2014 high (see weekly chart below).
With the last five hours of Friday’s session belonging to the bears, the pair solidified a key technical break of the nineteen-month level.
As significant as this break was, the close below the 2.00 horizontal level offers an opportunity that is immediately apparent in the upcoming week.
The daily chart below illustrates the head and shoulders pattern that has been forming since early August. Last Friday’s close confirms the reversal pattern and opens the door for a move to the first support area at 1.9520.
A break below that would expose the measured objective at 1.9100, an area that lines up with trend line support that extends off of the July 2013 low (see weekly chart above).
Summary: Watch for a selling opportunity on a retest of the 2.0030 level as new resistance. Key support comes in at 1.9520 with a measured objective at 1.9100. Alternatively, a daily close back above 2.0030 would negate the bearish bias in the short-term and expose trend line resistance at 2.0110.
Last but not least is AUDCAD, another Canadian dollar cross that made a significant break recently. The 0.9410 level can be seen acting as support between August of 2013 and July of 2015.
Following a break below this area on August 31st, the pair retested the 0.9170 level. This retest was not surprising given the fact that 0.9170 was a multi-year low, which often acts as a magnet of sorts.
However what was surprising is how the level failed to act as new resistance on September 14th, the day when AUDCAD rallied for 85 pips and closed back above the level. Although the bulls managed to push the pair back above 0.9410, they were not able to hold on to the gains for very long.
With the pair now trading back below 0.9410, traders can watch for continued weakness toward 0.9170. A break there would expose the next key support level at 0.8985, an area that has acted as support and resistance since the year 2000.
Summary: Watch for a selling opportunity on a daily close below 0.9170 with a target of 0.8985. Alternatively, bearish price action on a retest of the 0.9410 area could present a favorable opportunity with targets at 0.9170 and 0.8985.


