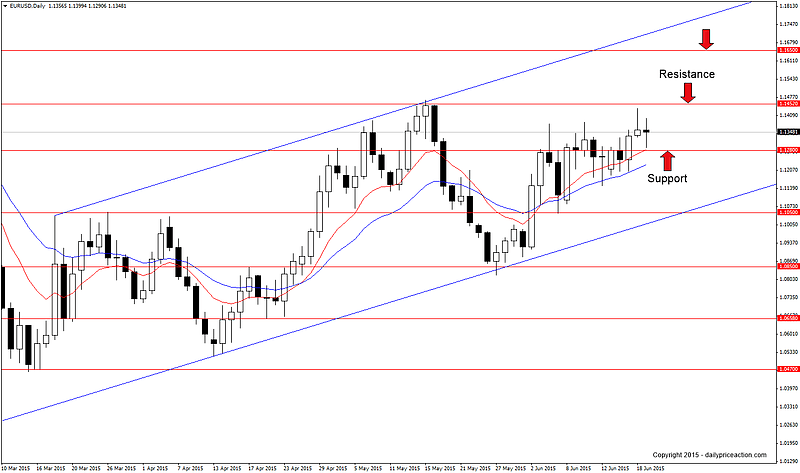
The slow but steady EURUSD rally continued for the fourth straight week last week. Although the pair has spent much of this time consolidating, the general momentum has remained bullish as the pair has advanced more than 500 pips since late May.
It goes without saying that this pair is exposed to the potential for extreme volatility given the situation in Europe. The fact that EURUSD has been fairly quiet over the past few weeks also lends itself to the idea that increased volatility may be on the horizon.
Whether that move will be up or down is anyone’s guess, but as long as the momentum remains bullish I will continue to watch for Euro strength across the market.
Summary: On the sidelines for now. A daily close above the May high at 1.4500 would expose the next key resistance level at 1.1650. Alternatively, a close below support at 1.1280 would expose the 1.1050 level.
GBPUSD is at an interesting crossroads. After a massive 700 pip rally that began in early June, the pair now sits between new support at 1.5814 and trend line resistance that extends off of the February 26th high.
The prudent thing to do from here is to wait for a break of trend line resistance before considering an entry. A break there would expose the 1.6180 resistance level. Alternatively, a break below support at 1.5814 would expose the next key support level at 1.5680.
I’m not ruling out the idea that the last six months of price action has carved out an inverse head and shoulders pattern. Although not the most obvious reversal pattern I’ve ever seen, it still hints at the idea that a much larger rally may be in store for the pound over the next several weeks and months.
Summary: On the sidelines for now. A daily close above trend line resistance would have us watching for a retest as new support. Key resistance comes in at 1.6180.
EURCAD continues to hold above the support area marked by 1.3765 and 1.3800. This area represents the neckline of the inverse head and shoulders pattern that developed between March and June.
After two weeks of consolidation the bulls started to show signs of life during Friday’s session as they managed to close the pair above 1.3915 for the first time since June 9th.
However buyers still face a major test with trend line resistance from March of 2014 looming just 70 pips above current levels. With the right amount of buying that test could come sometime this week.
Summary: Wait for a daily close above trend line resistance and then watch for a retest as new support. Key resistance comes in at 1.4070, 1.4212, 1.4340 with a measured objective at 1.4490.
The GBPCAD bulls have put on quite the show since early May, rallying more than 1,200 pips to put the pair within reach of the current 2015 high at 1.9555.
In the coming week we can watch for buying opportunities in the area between 1.9400 and 1.9440. Both levels are represented by daily highs last week.
In terms of resistance, there’s little doubt that the February high will attract sellers. That said, given the bullish momentum this pair has exhibited over the last two months I see no reason why a retest of trend line resistance from February of 2014 wouldn’t be in the cards.
Summary: Watch for a buying opportunity on a retest of the support area between 1.9400 and 1.9440. Key resistance comes in at 1.9555.
Last but certainly not least is NZDJPY. I have been tracking this broader head and shoulders pattern since the multi-year high was carved out last December. Given the way that the Fibonacci levels lined up from the 2009 low I had good reason to believe that a major top was in place.
Sure enough this year’s price action has produced the right shoulder and appears to have broken below the neckline during Friday’s session.
NZDJPY weekly chart
This break leaves us waiting for a retest as new resistance to start the trading week. The measured objective for the pattern comes in at the 75.00 handle which is also represented by several 2013 lows (see chart above).
Given the fact that this is a potential 1,000 pip move, it will not happen overnight. I expect such a move to take several weeks if not months to be fully realized.
Summary: Watch for a retest of the neckline to act as new resistance. Key support comes in at 82.25 and 80.00 with a measured objective at 75.00.


