Important: This site uses New York Close Forex Charts so that each 24-hour session starts and ends at 5 pm EST. These charts are essential for trading price action.
EURUSD struggled again last week, failing to stay above the 1.1190 area.
The pair also tested the multi-year lows at 1.1110. That’s an area that could introduce lower prices if broken this week.
But as always, until the euro closes below 1.1110, the level will continue to act as support.
Attempting to sell the EURUSD just above that 1.1110 region is risky in my opinion as the pair is still susceptible to buying pressure.
I prefer to either short the pair on retests of 1.1190 or following a daily close below the multi-year lows at 1.1110.
The latter would expose the next key support at 1.0860.
Alternatively, a close back above 1.1190 would target recent highs at 1.1280.
[thrive_custom_box title=”” style=”dark” type=”color” color=”#fef5c4″ border=”fadf98″]
Want to see how we’re trading these currency pairs and more?
Click Here to join us and save 40% – Ends July 31st!
[/thrive_custom_box]

GBPUSD looks ready for the next leg lower this week.
The pair has been trending lower since March, but the recent sideways price action has made it a tricky pair to trade.
That said, consolidation is a healthy sign for the continuation of any trend.
But it’s going to take a daily close below 1.2380 to get the pound moving again.
Until that occurs, GBPUSD is susceptible to buying pressure just like its euro counterpart above.
A daily close below 1.2380 would expose the 1.2100 handle.
Alternatively, a breach of last week’s highs at 1.2520 would expose 1.2580.

I wrote about the potential for further AUDUSD unwind on July 24th.
Given the long-standing downtrend coupled with a similar ascending channel to that of April, a move lower seemed almost certain.
Sure enough, AUDUSD is currently 70 pips lower since last Wednesday’s post.
Sellers also took out that ascending channel support near 0.6960. That’s the region we were eyeing for a short last week.
It’s no surprise then that I like that same 0.6960 area as resistance for the week ahead.
If you aren’t already short AUDUSD, selling strength into that 0.6950/60 region this week is a sensible approach in my opinion.
Key support on the way down includes the 0.6910 area along with the June low of 0.6831.
But if recent price action is any indication, I wouldn’t be surprised to see AUDUSD trading near 0.6750 in the days and weeks to come.
[thrive_custom_box title=”” style=”dark” type=”color” color=”#fef5c4″ border=”fadf98″]
IMPORTANT: I use New York close charts so that each day closes at 5 pm EST.
Click Here to get access to the same charts I use.
[/thrive_custom_box]

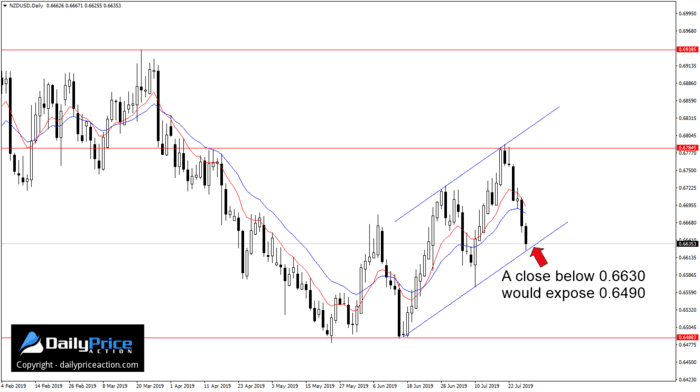
NZDUSD seems to be lagging its Australian dollar counterpart.
That’s good news if you miss out on selling the AUDUSD.
Notice how we have a similar ascending channel amid both a short-term and longer-term downtrend.
This type of consolidation is usually a recipe for continued weakness.
But first we need to see sellers take out channel support near 0.6630.
Until that occurs, expect to see a few bids crop up in this region.
On the other hand, a close below channel support near 0.6630 would expose recent lows at 0.6490.

GBPJPY encountered sellers late last week at 135.40.
That’s no surprise given how significant this level has become in recent weeks.
Notice how the pair caught a bid at 135.40 on June 18th and again several times during the first half of July.
As we know, old support becomes new resistance.
So as long as GBPJPY trades below 135.40 on a daily closing basis, I have to favor more downside here.
That said, I’m not nearly as interested in GBPJPY as I am with other pairs such as EURUSD, AUDUSD, and NZDUSD.
Key support for the GBPJPY include 133.80 followed by 132.30.
[thrive_custom_box title=”” style=”dark” type=”color” color=”#fef5c4″ border=”fadf98″]
Want to see how we’re trading these currency pairs and more?
Click Here to join us and save 40% – Ends July 31st!
[/thrive_custom_box]


Now you can get access to the same professional Forex charts I use!
Get access today: http://bit.ly/2UzPyiR
These charts give you five 24-hour sessions each week. They are essential if you trade from the daily or 4-hour time frames. Anything else can produce false buy and sell signals.
Download the platform here: http://bit.ly/2UzPyiR
Regards Justin for these highlights….They are an eye opener……I am doing all possible to become a lifetime member. I feel it is worth.
I always look forward to your analysis i must say my trading is base on 80% of what i learnt from you. Thank you.
Hi Justin
Could you also please throw some light on Gold? Thanks.
Wonderful analysis
Your chart is clean and clear. Your analysis is straightforward and very easy to comprehend. I Love it. Keep the good work on
Thanks for giving the key levels of GBPJPY
Great analysis
nice copy of analysis
Thank you for excellent analysis.
Thank you sir for this week review.it’s very informative.
Mr Justin, thanks for your analysis on GBPJPY.
Do you notice that Sellers have taken out both Key Support Levels. Great Job!!!
What is the next support Level for the GBPJPY?
you are always great sir. God will help you more. Thanks a lot gor the information