[thrive_custom_box title=”” style=”dark” type=”color” color=”#fef5c4″ border=”fadf98″]
Important: I Use New York Close Charts. Click Here to Use My Preferred Broker
[/thrive_custom_box]
The EURUSD gave up ground last week after closing above the 1.1875 handle on November 24. The area has lost some of its appeal for my part given the way price action has ‘chopped’ back and forth for several days.
However, despite the indecision shown by market participants, the Euro did manage a close above 1.1875 on a weekly closing basis. As such, it’s important to respect the upside potential here.
At the same time, the price hasn’t managed to move higher from trend line support that extends from the November low. Whether or not this is a sign of forthcoming weakness is anyone’s guess at this point.
I haven’t had any interest in the EURUSD given how indecisive the pair has been of late. I also think there are better options such as the GBPUSD, which is showing better directional cues than its Euro counterpart.
For the week ahead, there is a confluence of support at 1.1875. Key resistance comes in at 1.2040 with a minor area at the November high of 1.1960.

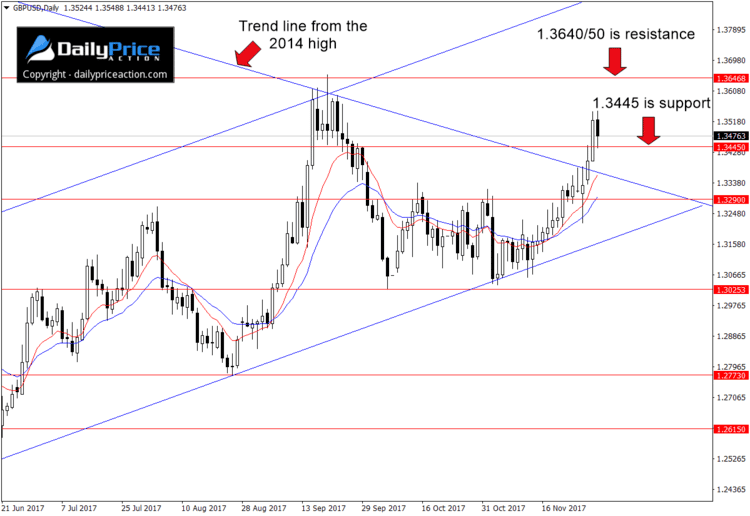
GBPUSD bulls accomplished a major feat last week. We have been watching this terminal pattern evolve for several weeks, noting that a break in either direction could have a lasting impression.
The trend line that broke down last Wednesday extends from the 2014 high, so it is indeed a significant break.
On top of that, the GBPUSD also cleared the 1.3445 handle on a daily and weekly closing basis. We can even see how buyers defended Friday’s retest of the area as new support.
As long as 1.3445 holds as support on a daily closing basis, traders can watch for buying opportunities here. The next key resistance comes in near the current 2017 high at 1.3640/50.
Note that this level was also the closing price of last year’s Brexit vote on the 24th of June. A daily close above that would target the February 2016 low of 1.3835.
Alternatively, a daily close at 5 pm EST (get New York close charts) back below 1.3445 would pave the way for a retest of former trend line resistance as new support. At the moment, that area comes in near 1.3330/40.

The USDCAD fell off a cliff on Friday after testing the 1.2900 area for the second time in four weeks. The 215 pip drop is the largest single-session loss so far this year.
Usually when a market loses this much ground on Friday it carries over into the new week. That’s precisely what I’m anticipating to happen here.
However, USDCAD bears face a critical test at the open. The 1.2670 area has served as support since the pair closed above it on October 25. It’s going to take a daily close (5 pm EST) below it to open up downside targets.
One area that I’ll be targeting if we get a sub 1.2670 close is the 1.2420 handle. It served as support in late July and again between September 28 and October 12.
The 1.2420 area is also 250 pips below key support at 1.2670. This agrees with the distance of the current range between 1.2670 and 1.2910, which comes in at 240 pips.
Alternatively, a daily close above 1.2910 would negate the bearish scenario described above. It would also expose the next key resistance level at 1.3160.

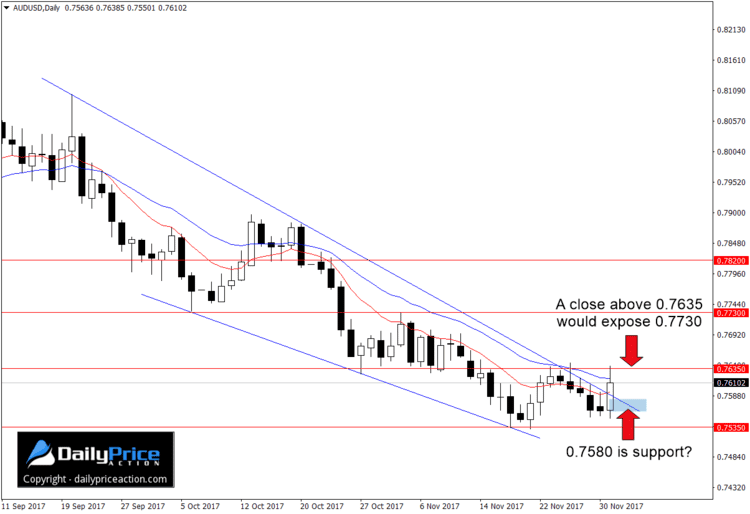
Since breaking trend line support on September 21, the AUDUSD has been in a freefall. The pair has lost 450 pips since the September 22 retest of former trend line support as new resistance.
However, recent price action hints at a possible floor just below Friday’s low at 0.7535.
Up until last week, the pair had carved a series of lower lows. If the Wednesday to Friday low at 0.7550 holds up this week, it would be the first higher low in months.
It’s important to remember that we can’t technically call this a higher low just yet, though. In order for that to happen, buyers need to push prices above the November 27 high at 0.7644.
And for me to consider this a buying opportunity, I need to see a daily close (New York 5 pm EST) above the 0.7635 handle. Only then can we claim that buyers are starting to regain control.
A daily close above 0.7635 this week would expose the next key resistance at 0.7730. The area served as a pivot between October 6 and November 2. It also played a role in capping the mid-June advance. Beyond 0.7730 we have 0.7820 followed by 0.7955.
Alternatively, a daily close below the November low at 0.7535 would negate any notion that AUDUSD bulls are in command of the situation.
If this is indeed a falling wedge, we should see buyers flock to the 0.7580 area if tested this week. I wrote a question mark next to the support level below because the pattern isn’t quite as clean as I like to see.
Still, it does appear that the Australian dollar is starting to get squeezed. If so, a pop higher could be just around the corner.

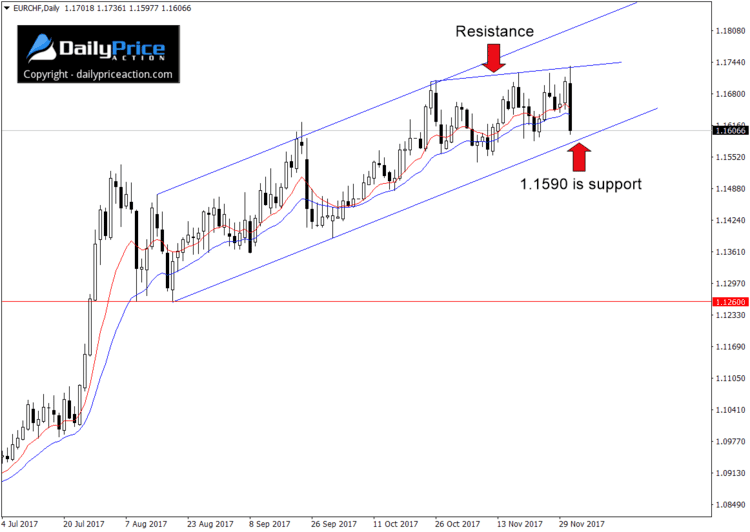
Remember the EURCHF? We discussed this potential upward sloping flag on November 6. However, for the past few weeks it has done nothing but consolidate further.
Sloping flag patterns are different from bull and bear flags. The former slopes with the trend while the latter forms against it. That means one suggests a continuation of the prior trend while the other signals a potential reversal.
As you can see from the chart below, the EURCHF has carved an upward sloping flag. The formation points in the same direction as the uptrend that began in February which suggests buyers are tiring.
There is also a short-term resistance level that has developed since the late October swing high. This illustrates how bulls have been unable to retest the channel top, which is another sign of exhaustion.
Just like a rising wedge, a flag pattern like the one below often targets the bottom of the formation. In the case of the EURCHF, that would be the August lows at 1.1260, approximately 340 pips below Friday’s close.
The trigger for a short entry would be a daily close (5 pm EST) below channel support. That level comes in at 1.1590 at the time of this writing. As mentioned above, the target would be the August lows at 1.1260.
[thrive_custom_box title=”” style=”dark” type=”color” color=”#fef5c4″ border=”fadf98″]
Want to See How We’re Trading These? Click Here to Join Justin and Save 70%
[/thrive_custom_box]


