
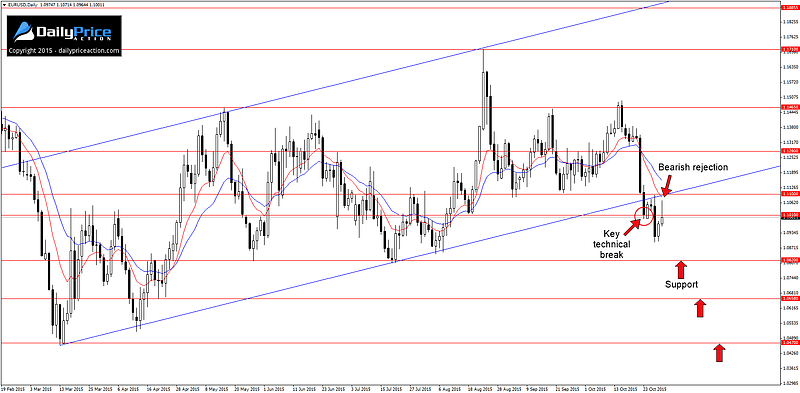
EURUSD was a mixed bag last week. After falling below the October 23rd low on the back of a hawkish FOMC statement, the single currency pared most of its losses during Friday’s session.
However those gains failed to stick as the pair quickly fell back below the 1.1100 handle before the weekend. I talk more about this in the EURAUD commentary below, but this spur of the moment rally had the look and feel of short covering, which is to be expected on the last trading day of the month.
I’m still bearish here and in fact continue to hold my short position from 1.1040. That said, I have tightened up my stop and will be keeping a close eye on this week’s price action.
Put simply, I don’t like the fact that the pair has now had seven closes below the moving averages without a single retest. My favorite way to use these moving averages is as a mean reversion tool. The length of time that the pair has held below them without a retest indicates that a move higher could be in the cards before the next leg down.
That aside, my bearish bias will remain intact as long as we remain below former channel support on a closing basis.
Summary: Watch for a selling opportunity while below former channel support on a closing basis. Key support below current levels comes in at 1.0820, 1.0658 and 1.0470. Alternatively, a close above former channel support would negate the bearish bias and expose key resistance at 1.1280.
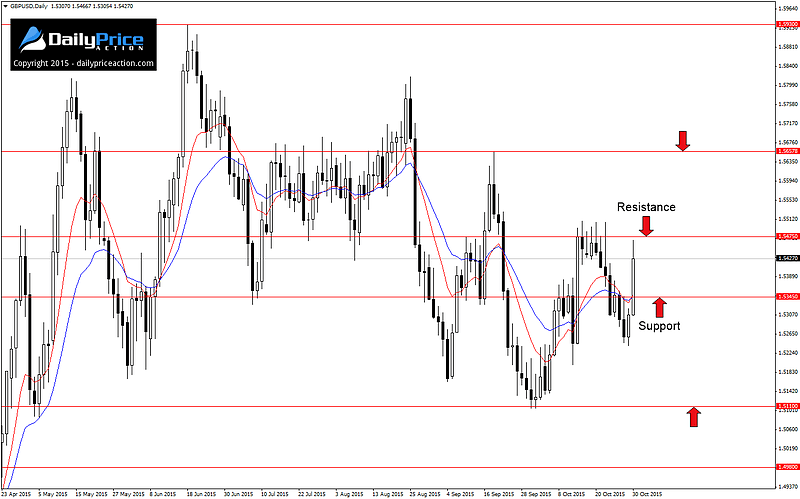
GBPUSD continues to lack any real direction. The pair recently broke below the 1.5345 handle, a level that has been in play since January. This move indicated that further weakness was likely, however Friday’s rally put a quick end to that idea.
With the pair now back above 1.5345, a retest of the October highs near 1.5475 is a likely scenario. A close above that would expose the September high at 1.5658, a level that previously acted as resistance between July and August.
The range-bound price action of late has kept me on the sidelines as neither the bulls nor bears have managed to tip the scales one way or the other. And, while a move above the October highs could offer a compelling reason to get long, I feel that pound strength through something like GBPNZD would have a higher chance of seeing follow-through. More on this later.
It has been mentioned by some that the price action since the September 4th low is reminiscent of an inverse head and shoulders. Of course it all comes down to how the market interprets the price structure, but with just 60 pips between the left shoulder and the head, I don’t personally consider this a tradable pattern.
Summary: On the sidelines for now. A close above 1.5475 combined with bullish price action could present a favorable opportunity to get long. Above that, key resistance comes in at 1.5658 and 1.5818. Alternatively, a close back below 1.5345 would expose the next key support level at 1.5110.
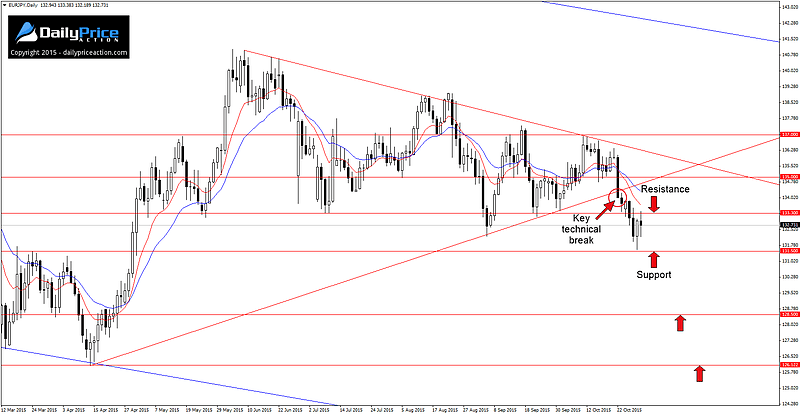
EURJPY has played out well for us thus far. The key technical break that occurred on October 22nd has so far led to a 250 pip decline.
As expected, the pair found initial support at 133.30, a level that has acted as support since May. However, last week’s selling pressure proved too strong as the pair quickly found itself at yet another obvious area of support at 131.50. This level lines up with the highs from mid to late March.
After moving down quite aggressively from the October 21st high, some consolidation below the 133.30 handle is likely. As such, traders can watch for selling opportunities while the pair remains below this level on a closing basis.
A secondary trade idea would be to wait for a close below the 131.50 support level. Such a close would open up the potential for a move down to the next area of value at 128.50.
Summary: Watch for selling opportunities while below 133.30 on a closing basis. Alternatively, a daily close below 131.50 could offer a favorable opportunity to get short for a move to the next support level at 128.50. Below that, key support comes in at the multi-year low at 126.08.
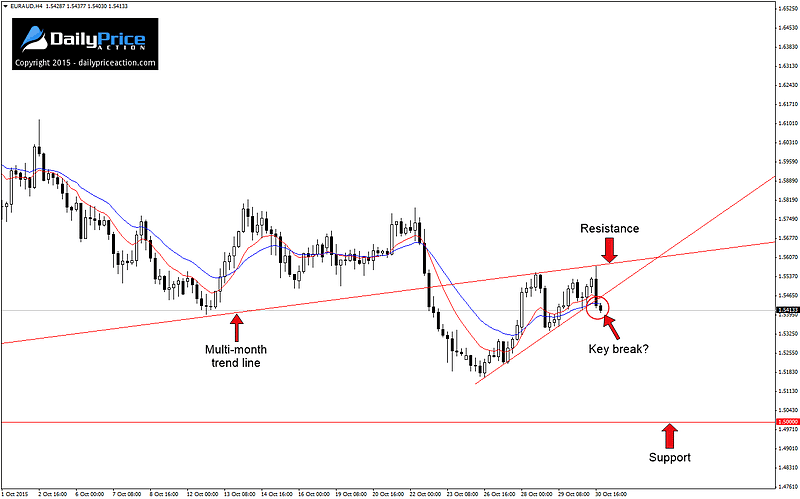
EURAUD gave us some trouble last week after forming a bearish pin bar on the daily chart. The setup had everything going for it given the recent break of trend line support, retest of the 1.5400 level as new resistance and the well-formed pin bar.
However unsuspected strength from the Euro during Friday’s session combined with Australian dollar weakness pushed the pair above Thursday’s high.
In typical fashion of volatile market conditions, EURAUD quickly lost 160 pips just after breaching the tail of Thursday’s pin bar. This decline put the pair below a well-defined trend line that extends off of the October 26th low.
My take on Friday’s strength from the Euro was sheer month-end profit taking. Many traders like to book profits on the last trading day of the month, and given the fact that the single currency was down 500 pips from the October high, it would make sense to see a substantial amount of short covering before the weekend.
This idea was confirmed when the Euro began to sell off again during the afternoon session on Friday. As the number of short coverings began to dissipate, so too did the ammo for a push higher, leaving the currency to fend for itself.
Summary: Watch for bearish price action on a retest of former wedge support as new resistance. Key support comes in at 1.50. Alternatively, a close above the multi-month trend line near 1.5600 would negate the bearish bias and turn our attention higher.
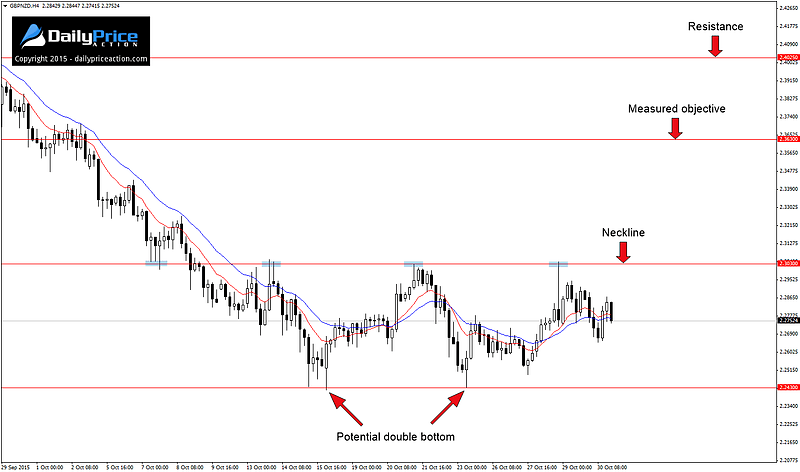
GBPNZD is my favorite potential setup at the moment. After a three-week slide lower following a five-month rally, the cross appears to have leveled off at the 2.2430 support level.
A look at the 4 hour chart shows the 600 pip range that has been carved out between 2.2430 and 2.3030. Within this range we can see a potential double bottom that has formed over the last two weeks. However keep in mind that only a close above the neckline at 2.3030 would confirm the pattern.
While it may be tempting to trade within this range, recent volatility makes trading a range-bound market unfavorable. Instead, I would rather see a break higher before considering an entry.
At this time I’m only interested in a move higher given the broader uptrend that has been in place since April. So while a break of support could offer an opportunity to get short, I believe that the greater opportunity lies in a continuation of the uptrend that has been in place for most of 2015.
Summary: Watch for a buying opportunity on a 4 hour close above the 2.3030 handle. The objective for the given range comes in at 2.3630 with another level of resistance coming in at 2.4025. Alternatively, a close below range support at 2.2430 would negate the bullish bias and keep us on the sidelines for now.