Can Friday’s non-farm payroll trigger a USDJPY breakout?
Watch the video below to find out what I think.
Be sure to also scroll down for more commentary and an annotated chart.
[thrive_custom_box title=”” style=”dark” type=”color” color=”#fef5c4″ border=”fadf98″]
Did you like that video?
Subscribe on YouTube to get notified when I post new videos every week!
[/thrive_custom_box]
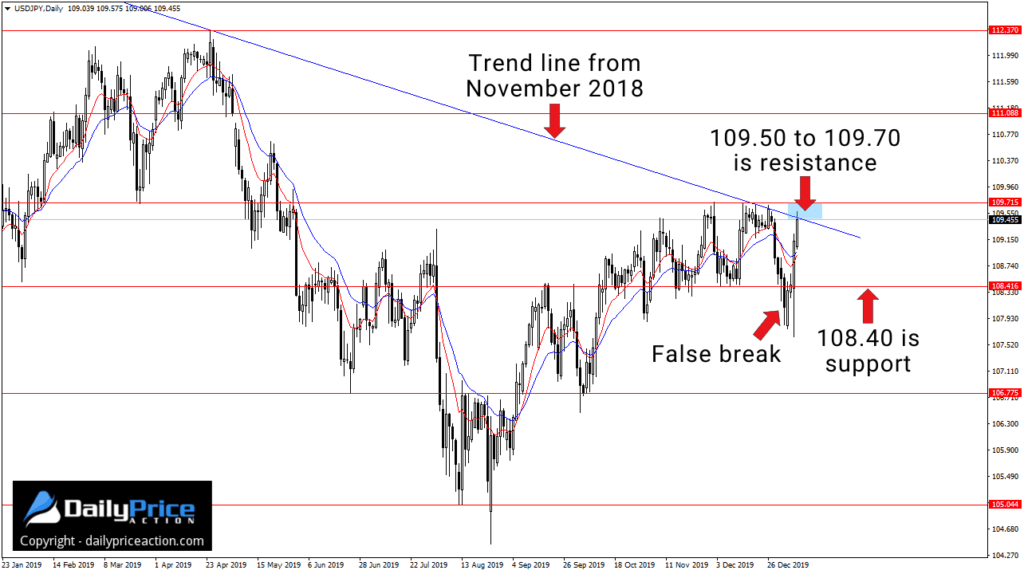
The USDJPY recently closed below the 108.40 key level.
Given the way this area supported the pair last November and December, the January 3rd close below it looked relatively bearish.
However, the USDJPY retested 108.40 as new resistance on the very next candle.
The lack of a “rounded retest” helped me avoid a short at 108.40.
I’ve discussed the importance of rounded retests before.
I even wrote a blog post on it using none other than the USDJPY as an example. See number one at the link above.
Immediate retests like the one that occurred between the 3rd and the 6th are how false breaks begin.
Sure, a rounded retest can lead to a false break too, but immediate retests like the one below are a big red flag in my book.
Even the January 7th session failed to back down from 108.40, and by the 8th it was clear that the false break was real.
As I’ve stated before, a false break often leads to an extended move in the opposite direction.
Because we’re dealing with a false break of support, it means that a move higher may not be far away.
But first, USDJPY bulls need to get through a key resistance level.
I’ve mentioned the trend line that extends from the November 2018 high several times now.
It’s the same trend line that triggered the selloff at the end of December.
So will tomorrow’s non-farm payroll (NFP) trigger a breakout and validate that “extended move in the opposite direction” theory?
We’ll see. The fact is that nobody knows what will happen.
That said, I do think it’s going to take a daily close above trend line resistance and also the 109.70 level to expose higher prices.
One such higher price is 111.10.
Notice the open gap near 111.10 that developed between the 3rd and 6th of May of last year.
That unclosed gap could serve as resistance if we see USDJPY push higher.
Just keep in mind that this 109.50 to 109.70 area will remain intact as resistance until we get a daily close above it.
Also, be sure to respect the potential for volatility on Friday as the market interprets tomorrow’s employment data at 8:30 am EST.
[thrive_custom_box title=”” style=”dark” type=”color” color=”#fef5c4″ border=”fadf98″]
Want daily videos of the currency pairs I’m trading?
Get a Lifetime Membership Today and receive exclusive member-only content including one to two new videos every day. Save 40% in January!
[/thrive_custom_box]


