USDJPY is surging higher today after sliding 330 pips lower since April 7th.
But today’s surge in price isn’t a surprise, at least not to Daily Price Action members or me.
Truth is, I’ve been buying the USDJPY since late April.
My first two attempts were unsuccessful, but both losses were minimal.
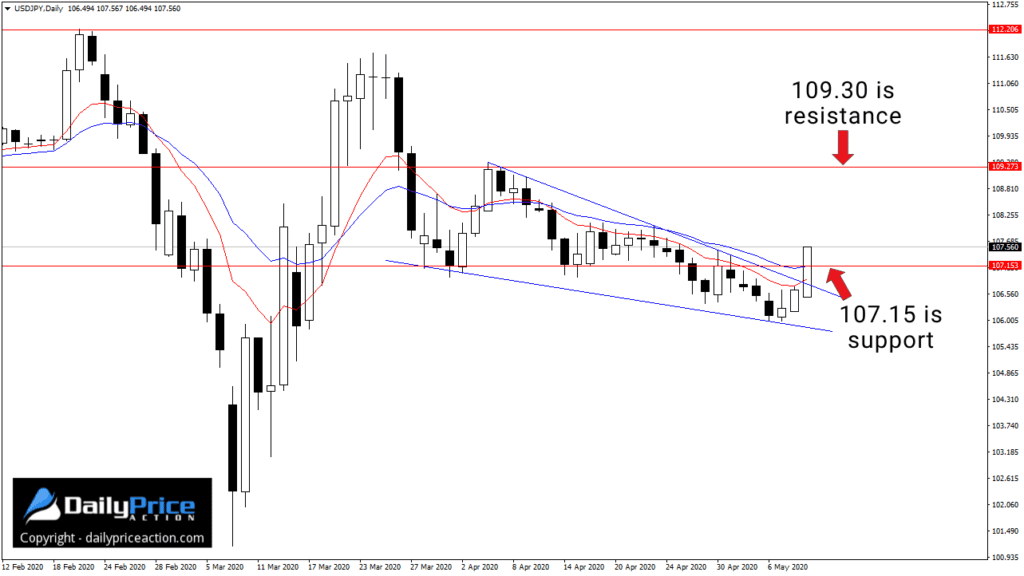
My third try last week, on the other hand, is now in the green by more than 100 pips as the USDJPY breaks free from a five-week falling wedge.
This pattern is something I pointed out to members on April 30th.
Based on the 4-hour time frame, there were two resistance levels in play.
But anyone familiar with patterns like this knows the end result is the same.
Instead of looking at the 4-hour chart today, I want to focus on the daily.
As you can see from the chart below (second chart), the USDJPY is not only breaking out of a falling wedge, but it’s also challenging the 107.15 area.
Notice how 107.15 served as support between late March and mid-April, and then flipped to resistance following the April 28th breakdown.
That makes 107.15 the hinge for the USDJPY.
And as of right now, it seems 107.15 is about to become support once more.
If USDJPY can close above 107.15 by today’s close at 5 pm EST, the next key resistance area is 108.00, followed by 109.30.
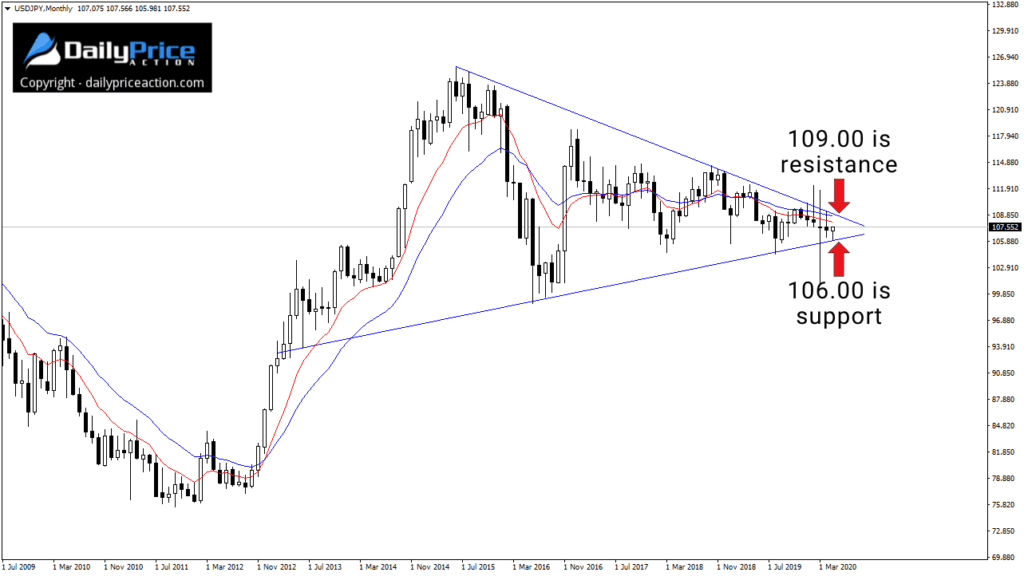
A test of 109.30 and monthly close above it would confirm a multi-year breakout, as illustrated by the monthly chart below.

I’ve maintained for weeks now that the pattern above is the one to watch.
A break from that wedge pattern would send USDJPY over 1,000 pips in either direction.
Given what I see in the broader picture here and elsewhere, my bet remains on a break higher, not lower.
[thrive_custom_box title=”” style=”dark” type=”color” color=”#fef5c4″ border=”fadf98″]
Want to watch the USDJPY video I just released in the member’s area?
Get a Lifetime Membership Today and receive exclusive member-only content including one to two new videos every day. Save 40% in May!
[/thrive_custom_box]


