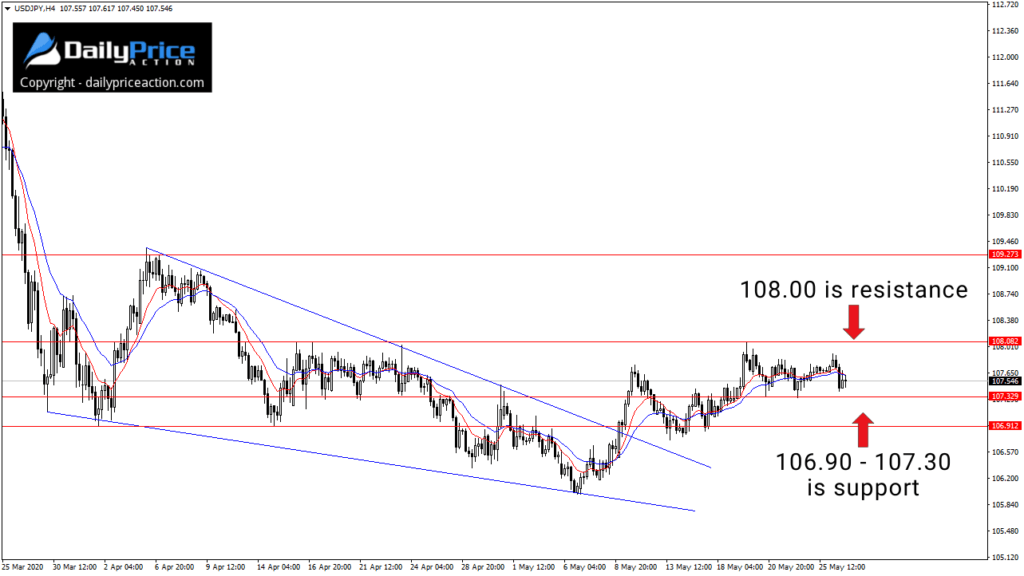
The USDJPY continues to move sideways between 107.30 and 108.00.
I’ve discussed the key levels I’m watching here several times, one of which is 107.80.
Buyers have managed to take USDJPY above 107.80 intraday. However, we’ve yet to see a daily close above that level.
We saw this happen on Tuesday when the market reached a high of 107.92 before selling off into the close.
This tells me that USDJPY needs to close above the 107.80 to 108.00 area if it intends to reach the 109.00 resistance area.
And if you’re a bear, sellers need to take out 107.30 and 106.90 to take prices down to key support at 106.00.
But everything that occurs between 106.00 and 109.00 is trivial, in my opinion.
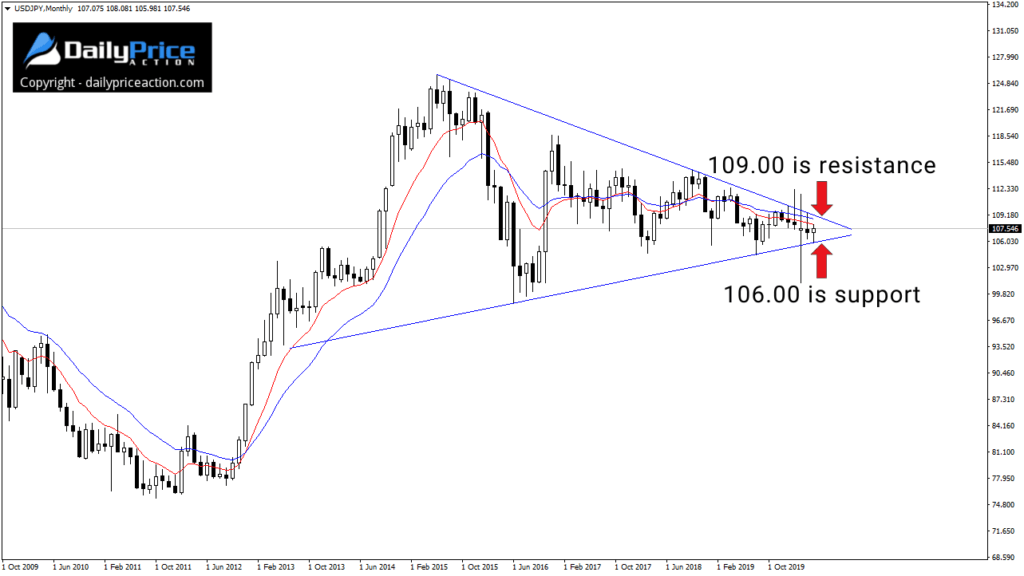
What matters for USDJPY over the next few months is which way this monthly wedge pattern breaks:

I’ve discussed this pattern several times in recent weeks.
The height of that pattern alone suggests a 3,000 pip move is coming for the USDJPY.
And because this is a terminal pattern, we know that USDJPY must break out of it by October at the latest.
That’s when wedge support and resistance converge.
My guess is we won’t have to wait nearly that long.
Of course, the question everyone wants to know is, which way will it go?
Nobody knows the answer as it depends on the first monthly close above wedge resistance or below support.
That said, I still think there is a strong chance the wedge above is a continuation pattern following the 2012 to 2015 rally.
As always, time will tell.
Disclaimer: I hold a USDJPY long position from 106.60.
[thrive_custom_box title=”” style=”dark” type=”color” color=”#fef5c4″ border=”fadf98″]
Want to watch the USDJPY video I just released in the member’s area?
Get a Lifetime Membership Today and receive exclusive member-only content including one to two new videos every day. Save 40% in May!
[/thrive_custom_box]


