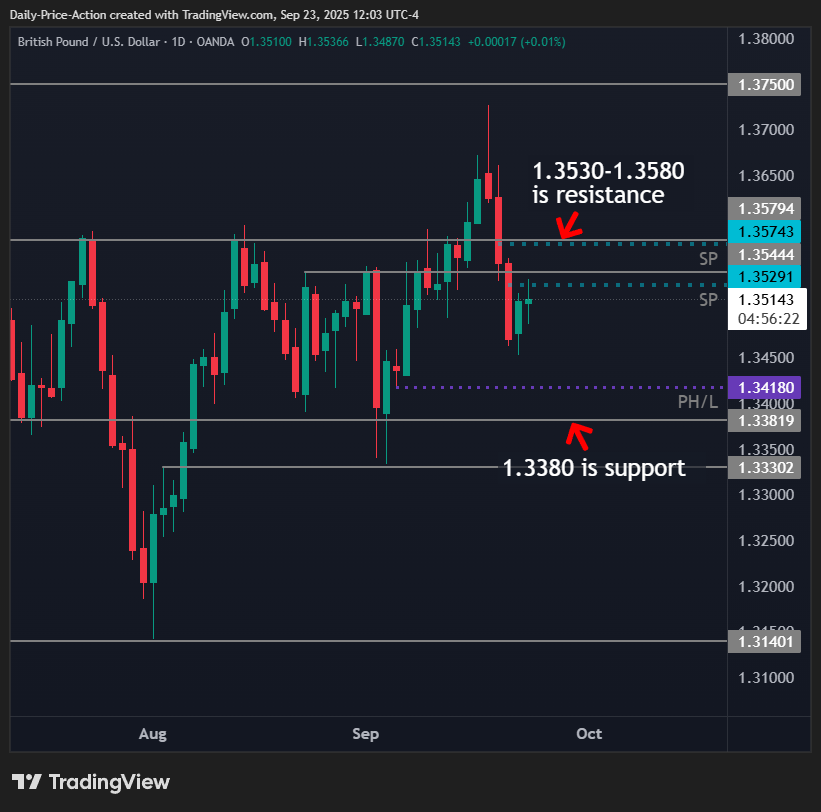
GBPUSD is bouncing so far this week, but 1.3573 is the resistance level to watch.
I show you why in today’s video, including how I’m trading the pair. I also share the latest on the US Dollar Index (DXY).
The pound is climbing this week, but last week’s drop below key levels remains significant.
GBPUSD retested the single prints near 1.3700 and came within a couple of pips of filling that zone before selling off.
That move also pushed the GBPUSD below 1.3580, making this week a key test.
On the weekly chart, the pound looks bearish. But zooming out, it has been sideways for weeks.
This is not a trending market at the moment. It is range-bound until proven otherwise.
One thing I am watching closely is the long upper wick from last week. In sideways markets, wicks like this often act like magnets.
That wick lines up with resistance near 1.3574, and there is still an open single print just below it.
The market already tagged one single print this week at 1.3529, but the one higher up has not been satisfied.
If GBPUSD moves up to test that zone, it could set up a rotation lower back toward the recent lows.
A poor low around 1.3418 is still open for business. That is another level that could attract price if sellers step in.
Currently, resistance is located near 1.3574, and support is positioned around 1.3418.
Until the market breaks one side, the pair is range-bound. Do not assume direction. Wait for price action to confirm.
Now, let’s turn to the US Dollar Index.
The DXY bounced hard last week during FOMC from the 2011 channel support around 96.60.
That is a 14-year level. Fading the dollar into that kind of support does not make much sense.
The daily chart shows the FOMC candle bouncing right from that zone.
But the DXY could not close last week above 97.70, which keeps it intact as resistance.
We also have a long lower wick from the recent selloff. The index is now working to fill that imbalance.
As long as DXY holds above 96.50 to 96.60, I think the safer bet is to look for bounces.
But the index has work to do to reclaim 97.70. A close above it would put some of those highs back in play.
On the flip side, a weekly or monthly close below 96.50 could open the door to a deeper breakdown.
For now, both GBPUSD and DXY are stuck in ranges.
The key is patience. Let price show its hand before jumping in.
Join us in the VIP Discord group for real-time market updates, VIP-only videos, my trades in real time, and the complete trading course.


