GBPUSD continues to look attractive from a swing trader’s perspective, and the current technicals lean toward one outcome this week.
Watch today’s GBPUSD video for my thoughts on the pair, including a trade I put on today. I also share the latest technicals for the US Dollar Index (DXY).
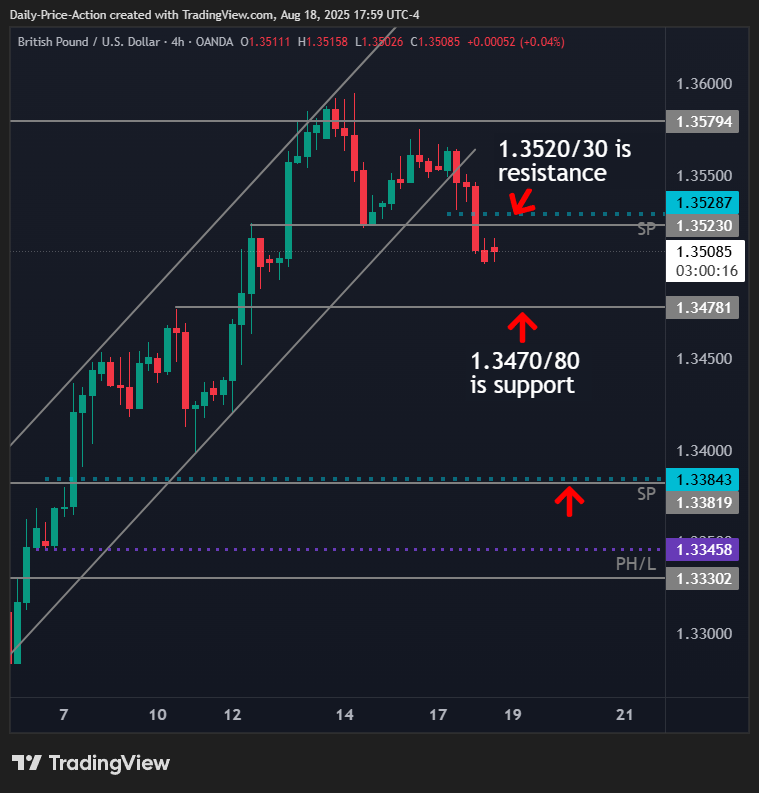
GBPUSD is breaking down following last week’s retest of the 1.3580 range highs. The pair carved a lower high on Friday, and is breaking its August channel support on Monday.
This aligns with the DXY bouncing from the 97.70 support area, one we’ve discussed several times in recent months.
There is also a sell-side single print at 1.3384. That’s near the 1.3380 support level. GBPUSD broke the level earlier this month, but never retested it as new support.
While there are no guarantees, areas like 1.3384 often serve as “magnets” for a market. Combine that with Friday’s lower high and Monday’s breakdown, and you have a recipe for lower GBPUSD rates this week.
That said, watch the 1.3470 area this week. That’s the mid-range of the current 1.3380 to 1.3580 range. There’s also a good amount of activity near 1.3470 since June.
Key resistance for GBPUSD is 1.3580. The 1.3525/40 area may flip to resistance on Monday, depending on where the next few 4-hour candles close.
I entered a GBPUSD short on Monday, a trade I shared with VIP members in real time.


