In this weekly Forex forecast, I’m going to show you exactly how I’m trading EURUSD, GBPUSD, USDJPY, EURGBP, and GBPCAD through February 28, 2020.
Watch the video below, and be sure to scroll down for more commentary and annotated charts.
[thrive_custom_box title=”” style=”dark” type=”color” color=”#fef5c4″ border=”fadf98″]
Did You Like That Video?
Subscribe on YouTube to get notified when I post new videos every week!
[/thrive_custom_box]
EURUSD Forecast
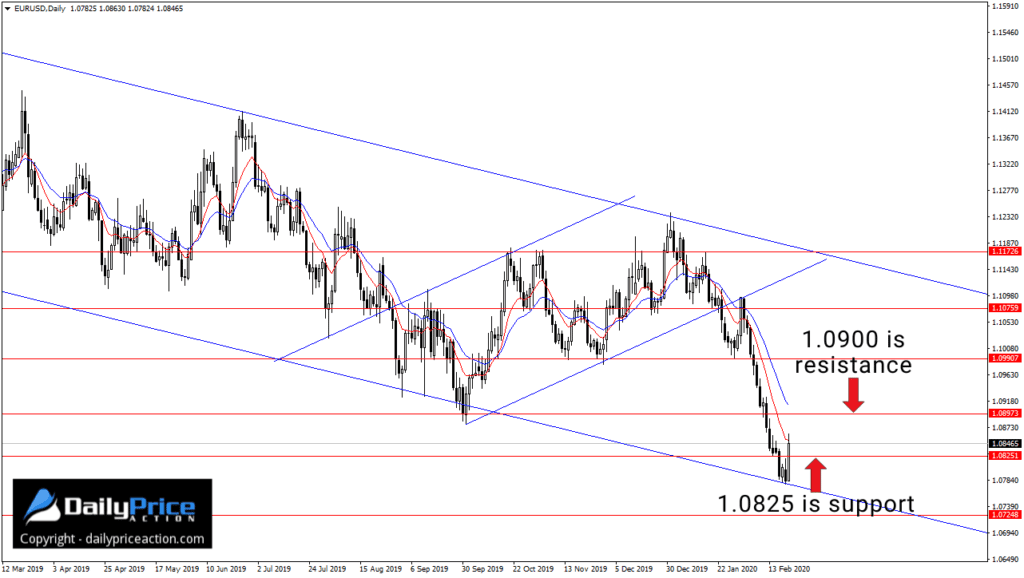
The EURUSD reached the bottom of a descending channel that I’ve discussed since September of last year.
That 1.0780 area is what triggered last week’s bounce.
Not only did the EURUSD carve a weekly candle with a long lower wick, but the pair also closed back above the 1.0825 key level.
Any retest of 1.0825 this week could attract buyers.
On the opposite end, the 1.0900 region is likely to serve as resistance on a push higher.
Now that the EURUSD has reached the bottom of this channel, though, I do think sellers need to be careful.
The recent price action suggests that we could see a rotation higher, especially if 1.0825 holds as support this week.
[thrive_custom_box title=”” style=”dark” type=”color” color=”#fef5c4″ border=”fadf98″]
Get Access To The Same New York Close Forex Charts I Use.
DOWNLOAD the charting platform for free!
[/thrive_custom_box]
GBPUSD Forecast
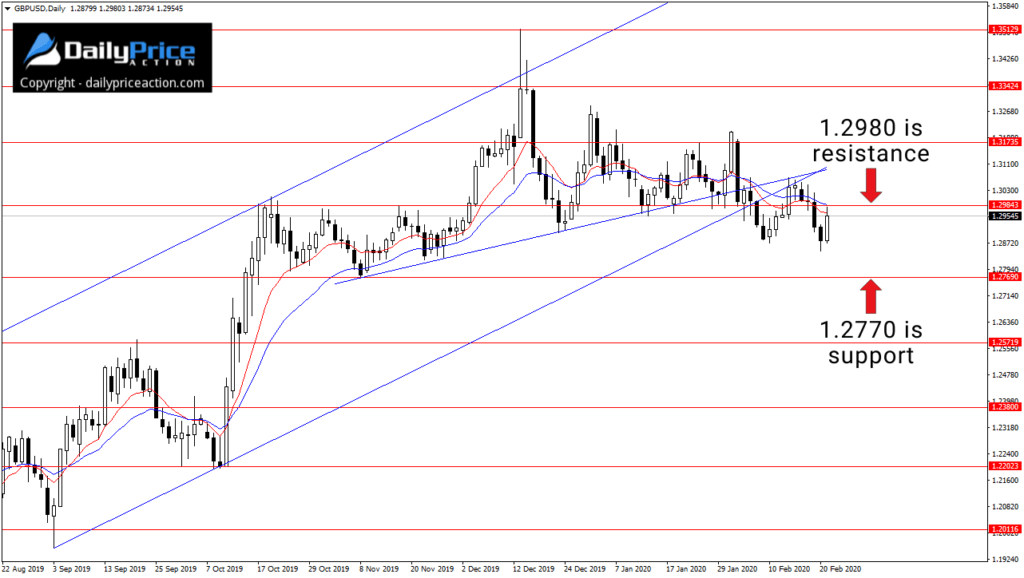
We got a decent move lower from GBPUSD last week after testing the 1.3050/70 resistance area I pointed out last Sunday.
However, that recent swing low at 1.2870 attracted buyers once again.
You can see how Friday’s session rallied from 1.2870 support and even retested the 1.2980 resistance area.
So, for now, the GBPUSD remains indecisive.
It’s likely going to take a break below that 1.2870 level to expose lower prices, including 1.2770 and perhaps 1.2570.
Alternatively, a daily close back above 1.2980 would open the door to the 1.3170 region.
USDJPY Forecast
The USDJPY is on the move again.
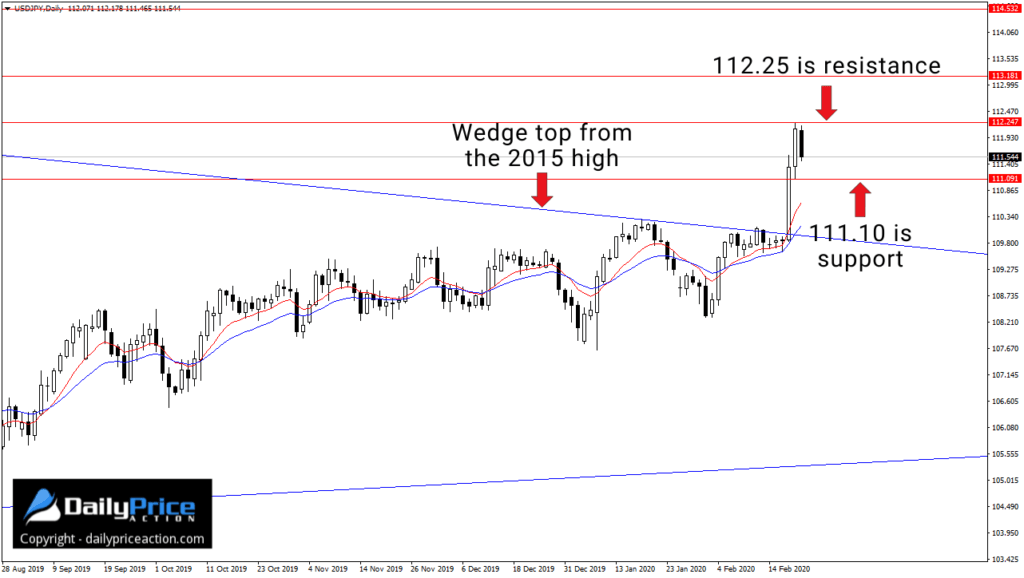
After months of consolidating, the risk-sensitive pair ripped 250 pips higher last week.
Most of those gains occurred on Wednesday when the pair closed higher by 150 pips, clearing that May 6, 2019 gap at 111.10.
I wrote about this level several weeks ago.
It’s no coincidence that Thursday’s session carved a low of 111.11 before rocketing higher by another 100+ pips.
But instead of talking about trivial details, I want to take a step back today and look at the bigger picture.
I also have no interest in discussing why the Japanese yen did what it did.
The price action is all that matters. It’s the only thing that determines whether an event or outcome is positive or negative for a currency.
Everything else is just noise, in my opinion.
With that in mind, here’s what USDJPY did last week:
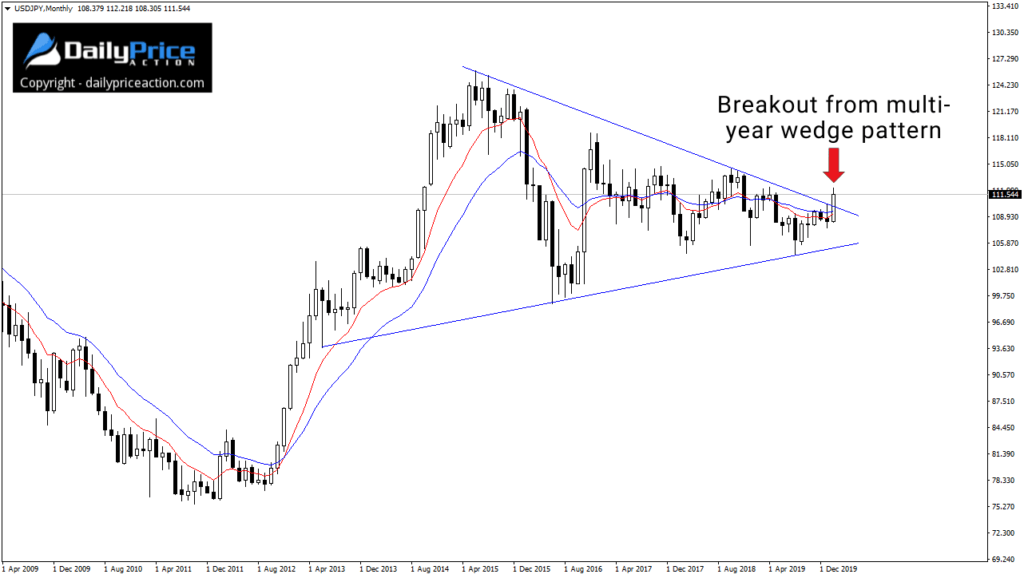
That’s the monthly time frame, but this wedge has been holding up on a weekly closing basis as well.
Like it or not, the risk-sensitive pair cleared the top of a wedge pattern that has been around since 2015.
Of course, we didn’t know this was a wedge until much later than that.
But unless this turns out to be a false break, last week’s rally was a significant move from the USDJPY.
It could very well re-establish the uptrend we saw between 2012 and 2015.
As long as USDJPY can stay above 111.10, that’s the first key support to keep an eye on this week.
We could also see a retest of the wedge top as new support, but that would result in a much deeper retracement.
As for key resistance, last week’s high at 112.25 is one to watch, as well as 113.20 and the range top at 114.50.
[thrive_custom_box title=”” style=”dark” type=”color” color=”#fef5c4″ border=”fadf98″]
Want Me To Help You Become A Better Forex Trader?
Get a Lifetime Membership Today and receive exclusive member-only content including one to two new videos every day. Save 40% in February!
[/thrive_custom_box]
EURGBP Forecast
The EURGBP idea in today’s forecast is more speculative than most.
However, there are a few reasons why I like the idea of a bottom here.
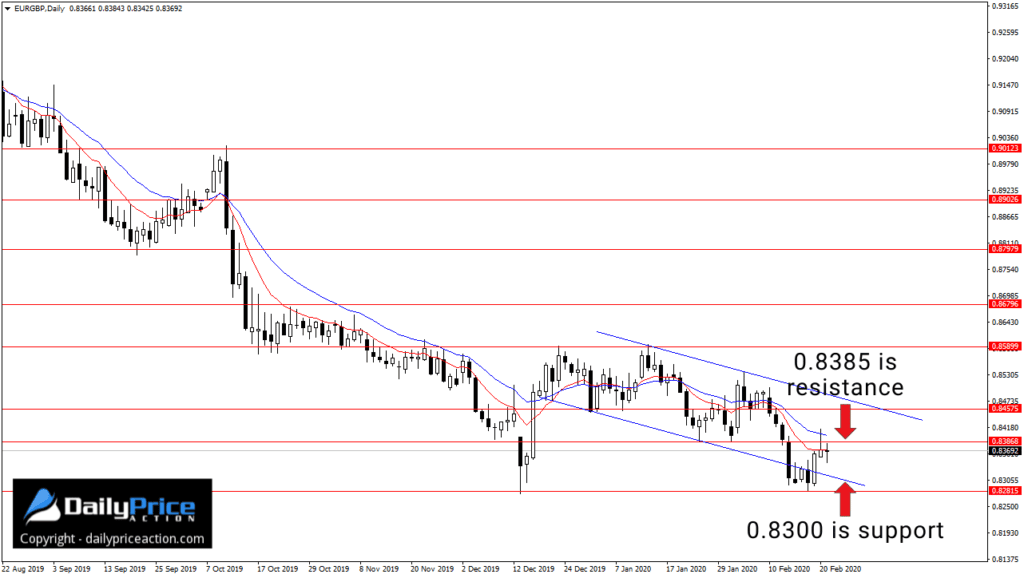
First, the EURGBP is coming off an area at 0.8300 that has served as range support since mid-2016.
The recent price action also hints at what could be a double bottom.
Just keep in mind that EURGBP buyers need to secure a close above 0.8590 to confirm the pattern.
As you can see, they have a lot more work to do here.
And third, the EURGBP just closed back inside this short-term descending channel, which could hint at a rotation higher.
Be sure to watch the video above for all of the details.
GBPCAD Forecast
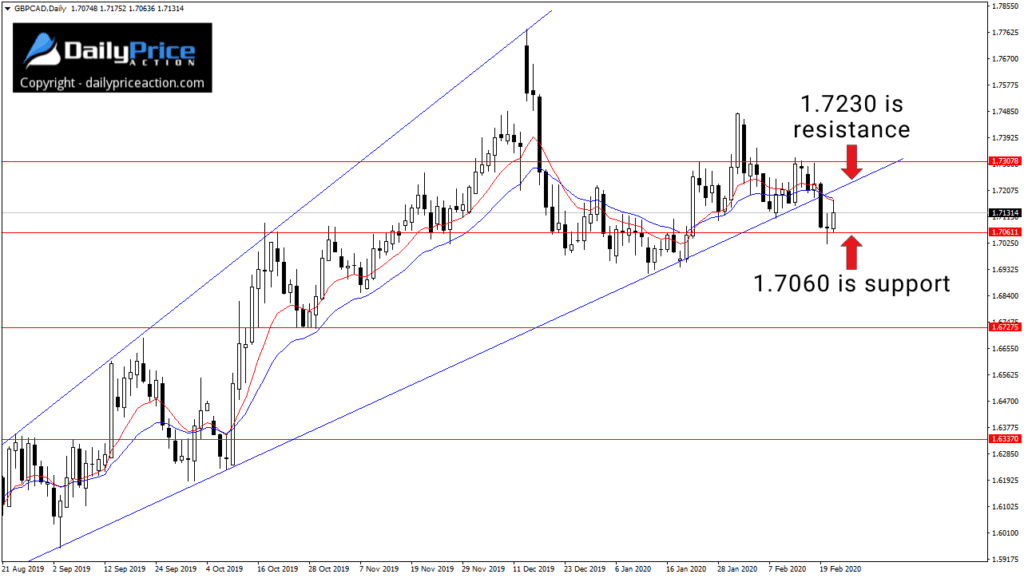
GBPCAD has been on my radar since February 7th.
The rising broadening wedge hinted at exhaustion from buyers, as did the lower high from late January and early February.
Notice how GBPCAD closed below wedge support last Wednesday, which confirmed the wedge pattern.
We also saw the pair bounce from the 1.7050/60 support area, which is the key level I’ve pointed out in recent posts.
It’s going to take a daily close below 1.7050/60 to expose lower levels including 1.6730.
Keep in mind that there will be other key levels along the way, but 1.6730 will be my target if sellers can clear 1.7050/60.
[thrive_custom_box title=”” style=”dark” type=”color” color=”#fef5c4″ border=”fadf98″]
Get Access To The Same New York Close Forex Charts I Use.
DOWNLOAD the charting platform for free!
[/thrive_custom_box]
