In this weekly Forex forecast, I’m going to show you exactly how I’m trading EURUSD, GBPUSD, USDJPY, AUDUSD, and XAUUSD through October 16, 2020.
Watch the video below, and be sure to scroll down to see the charts and key levels for the week ahead.
[thrive_custom_box title=”” style=”dark” type=”color” color=”#fef5c4″ border=”fadf98″]
Did You Like That Video?
Subscribe on YouTube to get notified when I post new videos every week!
[/thrive_custom_box]
EURUSD Technicals
The EURUSD could be carving a descending channel.
Given the uptrend since March, this could serve as a bull flag pattern.
The euro also broke above a short term trend line last week, suggesting a move higher in the week ahead.
However, as of now, the EURUSD is in the middle of a range between 1.1600 support and 1.1950 resistance.
So unless you bought the last dip into 1.1600, it might be best to stand aside for now.
I’m still anticipating a continuation of this uptrend, but that may not be possible until buyers take out the 1.1950 area.
My longer-term target for EURUSD remains 1.2500.
[thrive_custom_box title=”” style=”dark” type=”color” color=”#fef5c4″ border=”fadf98″]
Want Me To Help You Become A Better Forex Trader?
Get a Lifetime Membership Today and receive exclusive member-only content including one to two new videos every day. Save 40% in October!
[/thrive_custom_box]

GBPUSD Technicals
There’s a lot of bearish GBPUSD rhetoric online these days.
However, one look at the monthly time frame indicates that a bearish bias may be ill-advised, at least in the long run.

The falling wedge above hints at a turn higher over the coming months.
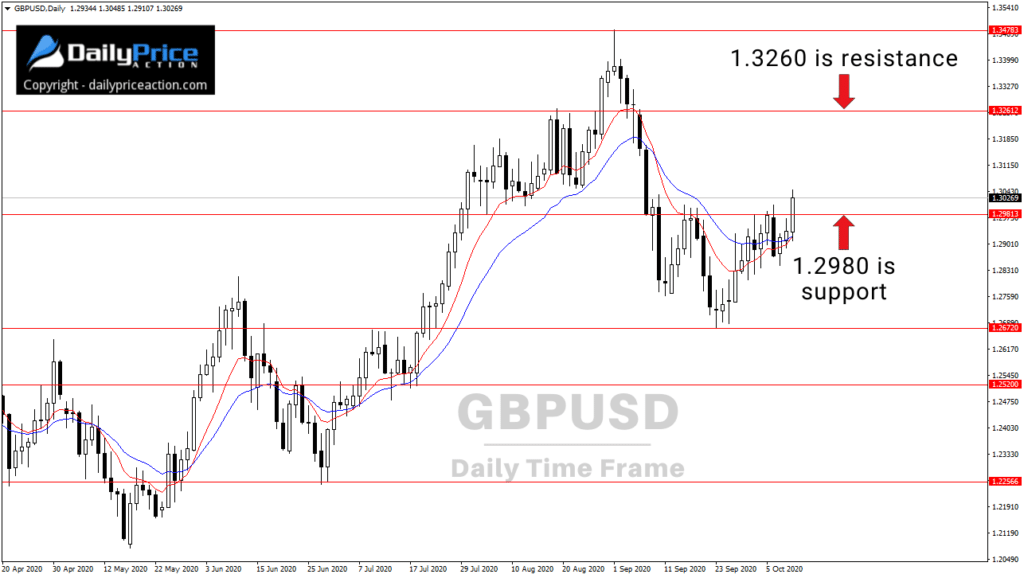
Turning to the daily time frame, you can see where GBPUSD closed above the 1.2980 level last week.
I’ve mentioned 1.2980 a few times in recent weeks.
It was the level buyers had to clear to open the door to 1.3260.
As long as 1.2980 holds as support on a daily closing basis, I like the idea of a higher GBPUSD this week.

USDJPY Technicals
It’s no secret that I’ve been bearish USDJPY for a few months.
Ever since the pair closed below a multi-year level, sellers have been in control.

But despite that breakdown, USDJPY has held up relatively well.
That isn’t too surprising, though, given that the entire market has been at a standstill.
If you recall my last USDJPY post, I pointed out a trend line from the March low.
As you can see from the chart below, the pair intersected with that level at 106.10 on October 7th.
Since then, the USDJPY has come under selling pressure.
Just keep in mind that sellers need to take out the 104.20 area to expose the 101.00 target I’ve had on my chart for several months.
Given the lower highs since February, a breakdown seems imminent.
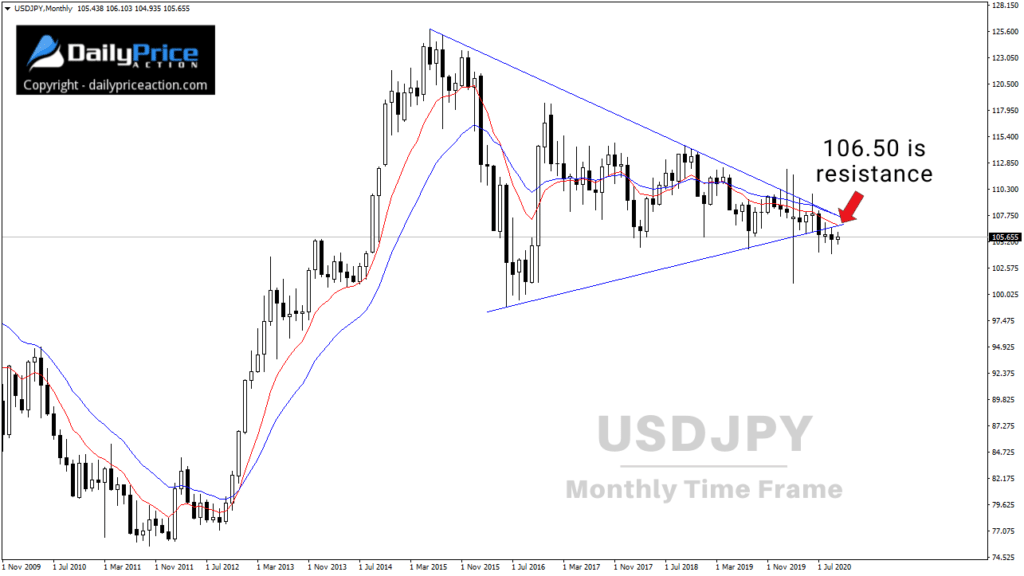
On the other hand, if USDJPY bulls were to take out the 106.50 resistance area on a daily closing basis, it would negate the bearish outlook.
That doesn’t seem likely at the moment, though.
[thrive_custom_box title=”” style=”dark” type=”color” color=”#fef5c4″ border=”fadf98″]
Get Access To The Same New York Close Forex Charts I Use.
DOWNLOAD the charting platform for free!
[/thrive_custom_box]

AUDUSD Technicals
AUDUSD is testing a short-term trend line from the year-to-date high.
If buyers can clear 0.7240 on a daily closing basis, we could see the pair push higher into 0.7320 and perhaps 0.7400.
Alternatively, a rotation lower this week should encounter buying pressure at 0.7200 or just below it.

XAUUSD Technicals
Gold (XAUUSD) made a significant move on Friday.
I’ve been discussing the structure below for several weeks now.
Friday’s close above the confluence of (former) resistance at 1910 suggests a move to 1970 this week.
At least that’s the game plan as long as 1910 holds as support on a daily closing basis.
A close above 1910 would expose 2015 and perhaps 2075.
[thrive_custom_box title=”” style=”dark” type=”color” color=”#fef5c4″ border=”fadf98″]
Want Me To Help You Become A Better Forex Trader?
Get a Lifetime Membership Today and receive exclusive member-only content including one to two new videos every day. Save 40% in October!
[/thrive_custom_box]


