In this weekly Forex forecast, I’m going to show you exactly how I’m trading EURUSD, GBPUSD, NZDUSD, XAUUSD, and VETBTC through October 9, 2020.
Watch the video below, and be sure to scroll down to see the charts and key levels for the week ahead.
[thrive_custom_box title=”” style=”dark” type=”color” color=”#fef5c4″ border=”fadf98″]
Did You Like That Video?
Subscribe on YouTube to get notified when I post new videos every week!
[/thrive_custom_box]
EURUSD Technicals
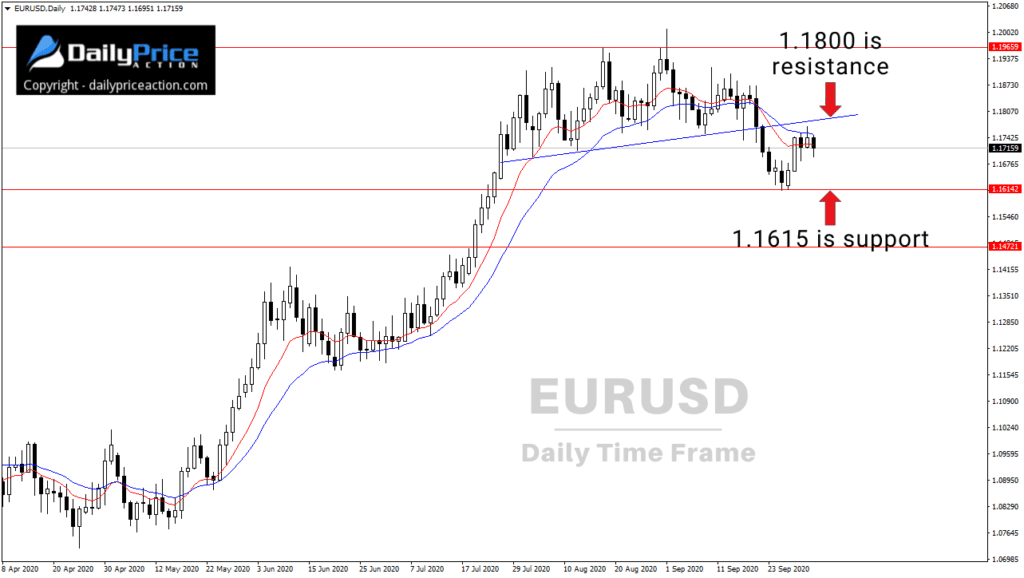
The EURUSD continued its sideways movement last week.
And as I wrote on September 30th, buyers need to secure a daily close above 1.1800 to send the pair higher.
So far, they haven’t been able to do that.
Last week, I told members that I wouldn’t be surprised to see one more pullback from EURUSD before the next leg higher.
One area I’m keeping a close eye on is between 1.1450 and 1.1500.
That’s the top of the multi-year trend line that I’ve discussed for months.
[thrive_custom_box title=”” style=”dark” type=”color” color=”#fef5c4″ border=”fadf98″]
Want Me To Help You Become A Better Forex Trader?
Get a Lifetime Membership Today and receive exclusive member-only content including one to two new videos every day. Save 40% in October!
[/thrive_custom_box]
GBPUSD Technicals
The GBPUSD looks less favorable than EURUSD, in my opinion.
It has the same short term uptrend, but the price action isn’t as telling as its euro counterpart.
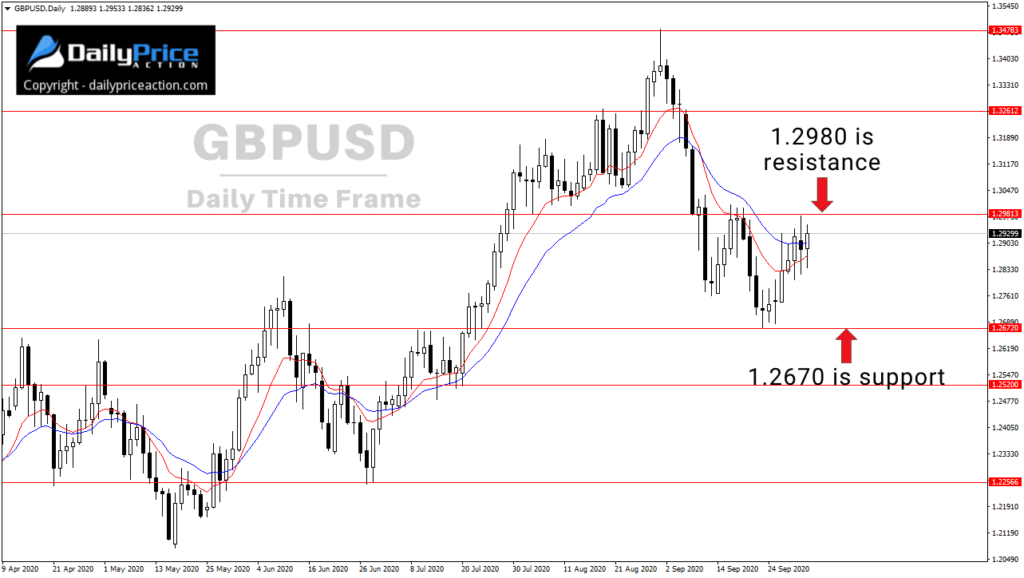
GBPUSD buyers need to secure a daily close above 1.2980 to send the price higher.
Notice how 1.2980 has served as resistance for several weeks.
Support for the week ahead comes in around 1.2670.
NZDUSD Technicals
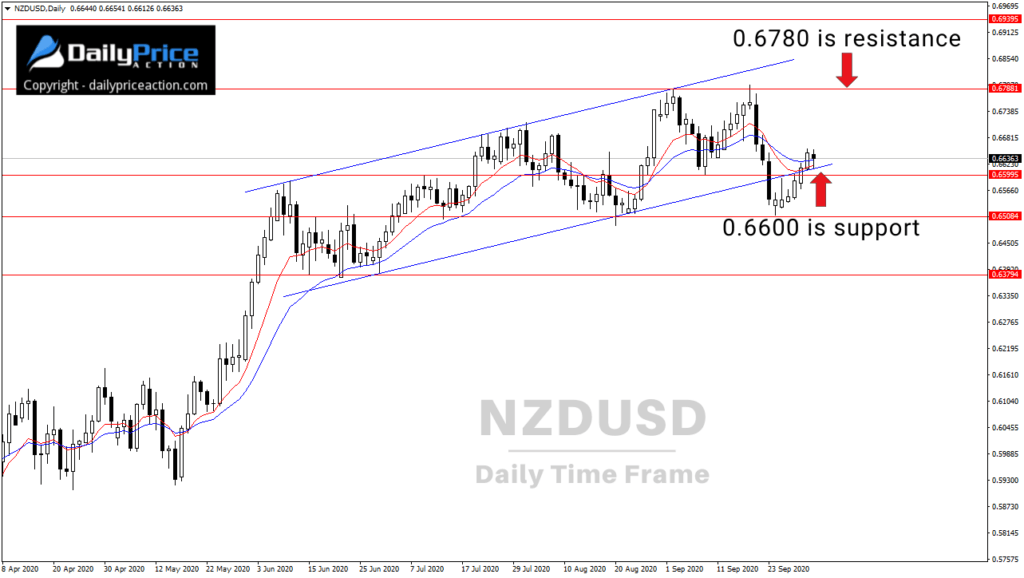
The NZDUSD closed back above 0.6600, which is an area I mentioned last week.
However, this rally isn’t all that convincing.
There’s still a chance NZDUSD stalls out near 0.6700, which could produce a topping pattern in the form of a head and shoulders.
I like NZDUSD higher over the long term, but I do expect further weakness before the next leg higher can materialize.
0.6600 is support for the week ahead, with 0.6780 serving as resistance.
[thrive_custom_box title=”” style=”dark” type=”color” color=”#fef5c4″ border=”fadf98″]
Get Access To The Same New York Close Forex Charts I Use.
DOWNLOAD the charting platform for free!
[/thrive_custom_box]
XAUUSD Technicals
I wrote about gold (XAUUSD) on Friday.
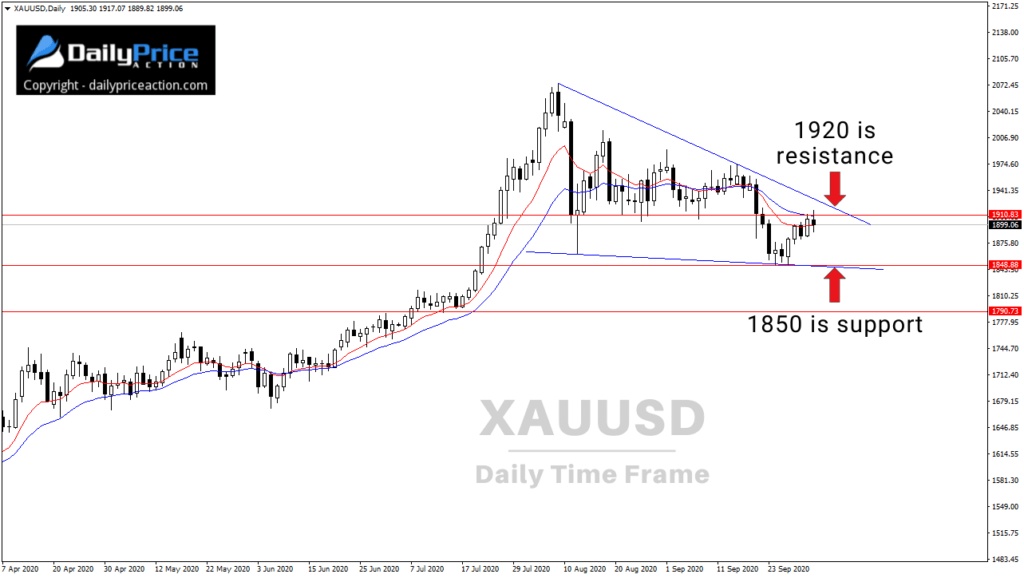
The key takeaway from that post was that the 1910 to 1920 region is serving as resistance.
That’s the area buyers need to break to send gold higher.
However, if we do see another pullback, keep an eye on the 1850 region.
I mentioned to DPA members last week how this could be the beginnings of a falling wedge pattern.
If 1850 fails, look to 1790.
All in all, I continue to like the idea of looking for buying opportunities on pullbacks or bullish breakouts.
VETBTC Technicals
VeChain against Bitcoin (VETBTC) is an interesting pair.
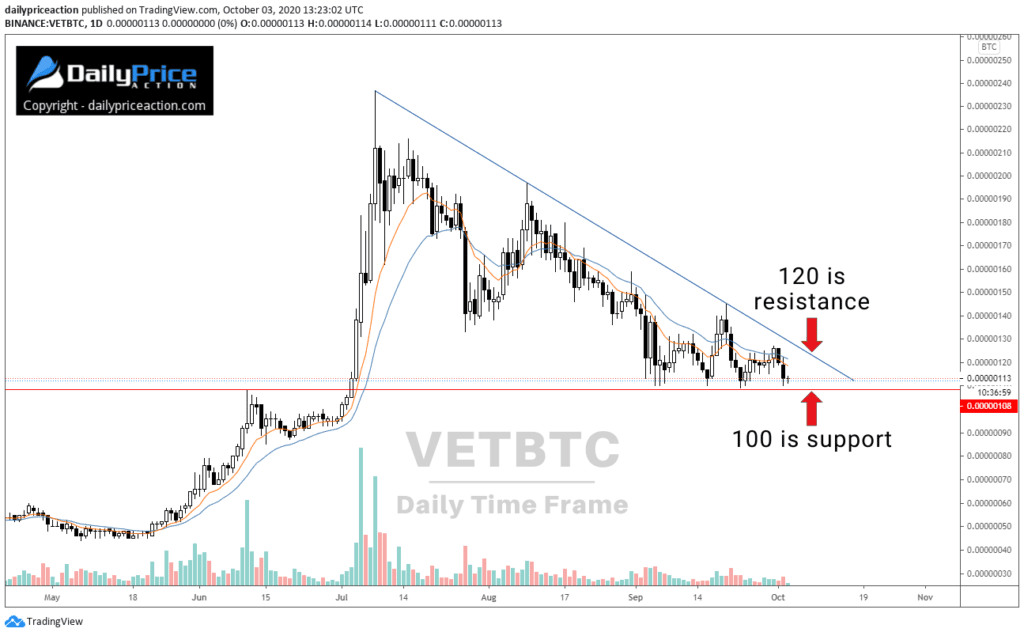
A view of the daily time frame shows a triangle pattern that has formed since the pair carved the recent high around 240 sats.
The 100 sats area is currently serving as support, which isn’t surprising considering it was long time resistance in 2019 and earlier this year.
As I mentioned in today’s video (above), we could see a dip below 100 sats to clear out any stops before the pair can move higher again.
But ultimately, buyers need to climb above trend line resistance near 120.
[thrive_custom_box title=”” style=”dark” type=”color” color=”#fef5c4″ border=”fadf98″]
Want Me To Help You Become A Better Forex Trader?
Get a Lifetime Membership Today and receive exclusive member-only content including one to two new videos every day. Save 40% in October!
[/thrive_custom_box]
