In this weekly Forex forecast, I’m going to show you exactly how I’m trading EURUSD, GBPUSD, AUDUSD, XAUUSD, and ETHBTC through November 6, 2020.
Watch the video below, and be sure to scroll down to see the charts and key levels for the week ahead.
[thrive_custom_box title=”” style=”dark” type=”color” color=”#fef5c4″ border=”fadf98″]
Did You Like That Video?
Subscribe on YouTube to get notified when I post new videos every week!
[/thrive_custom_box]
EURUSD Technicals
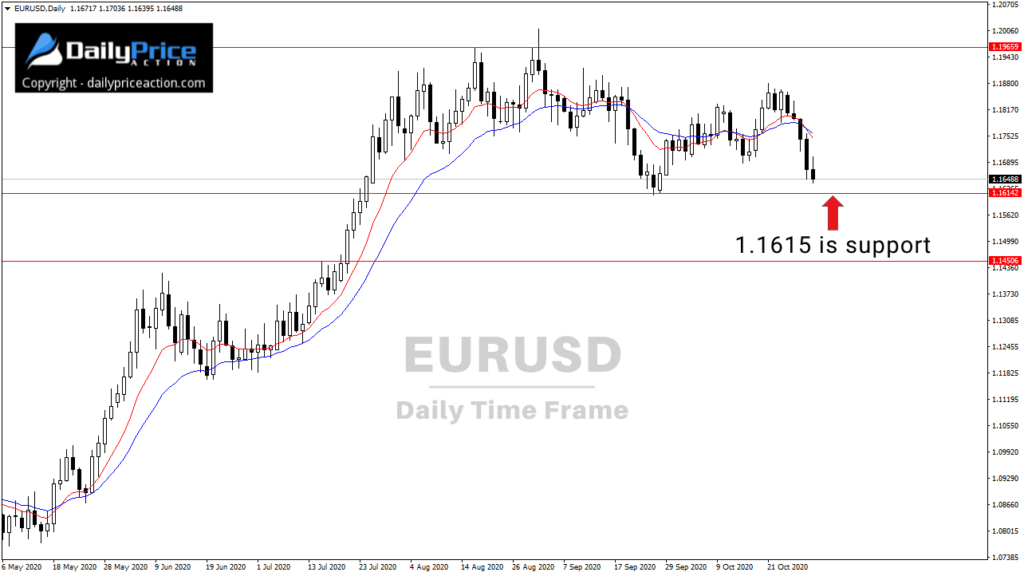
EURUSD sold off aggressively last week after failing to test the 1.1950 region.
This was always a possibility while trading in this range.
I’ve also thought that a move toward 1.1450 was likely, as I’ve mentioned in recent weekly forecasts.
So for now, that’s the narrative I’m going to go with.
A break below 1.1615 would expose 1.1450, which agrees with the September bearish engulfing month.
The 1.1450 region is also a confluence of support that could send EURUSD higher.
That’s where I’ll be waiting.
I won’t be doing much here or anywhere else in the coming week given Tuesday’s US elections, which are sure to shake things up.
[thrive_custom_box title=”” style=”dark” type=”color” color=”#fef5c4″ border=”fadf98″]
Want Me To Help You Become A Better Forex Trader?
Get a Lifetime Membership Today and receive exclusive member-only content including one to two new videos every day. Save 40% in October!
[/thrive_custom_box]

GBPUSD Technicals
GBPUSD looks set to break lower.
The potential lower high recently suggests weakness, but it’s going to take a daily close below the May trend line to expose lower levels.
Two such support levels are 1.2670 and 1.2520.
Alternatively, a move above the recent 1.3170 high would indicate strength and open the door to 1.3260.
I like GBPUSD lower, but only if sellers can take out the May trend line.

AUDUSD Technicals
I wrote about AUDUSD on Thursday.
The idea that the pair could sink lower is real, but only if sellers can break 0.7020 on a daily closing basis.
As of Friday’s price action, AUDUSD is holding above that key support.
If sellers can force a close below 0.7020, it will open the door to 0.6830.
Alternatively, a move higher and daily close above channel resistance would be bullish.
[thrive_custom_box title=”” style=”dark” type=”color” color=”#fef5c4″ border=”fadf98″]
Get Access To The Same New York Close Forex Charts I Use.
DOWNLOAD the charting platform for free!
[/thrive_custom_box]

XAUUSD Technicals
Gold (XAUUSD) continues to consolidate above 1850 support.
That’s a confluence of support per the key horizontal level and trend line that extends from the August 12th low.
On the other end, the 1900 region is likely to attract sellers.
All in all, though, XAUUSD continues to look constructive for a move higher.
Whether that happens over the next few weeks or next year is yet to be seen, but gold is likely headed higher over the long term.

ETHBTC Technicals
Both Bitcoin and Ethereum are up huge since I first wrote about them in May and June, respectively.
Bitcoin was trading at $8,828, which marks a 50% gain so far, and Ethereum was $243, or a 56% gain as of today’s price.
I was telling DPA members about these investments long before that when Bitcoin was $7,000 and Ethereum was just over $200.
As I’ve stated before, I’m treating cryptos like Bitcoin, Ethereum, and VeChain as investments.
That’s because of where they are in the broader cycle.
But I realize not everyone wants to buy and hold.
If you’re looking for a trade in the crypto space, ETHBTC is one worth keeping an eye on.
That’s Ethereum (ETH) versus Bitcoin (BTC).
I mentioned this pair on Twitter a few months ago as it was breaking out of a multi-year descending trend line.
$ETHBTC is on the verge of breaking out.
— Justin Bennett (@JustinBennettFX) June 23, 2020
I’m still a Bitcoin bull, but asymmetry favors Ethereum.#Bitcoin #Ethereum pic.twitter.com/H59xbC1f6z
That breakout triggered a 62% rally.
Since then, ETHBTC has pulled back about 30% as of today’s price.
What’s interesting is the pattern that’s formed since the late 2018 price action.
If it plays out, it points to a 120% rally from today’s price that should take us well into 2021.
A retest of the support area between 0.0246 and 0.0270 would be closer to a 150% rally.
I’m using a measured objective to calculate both of those targets, which is 0.0650.
Just keep in mind that ETHBTC may have another five to thirteen percent of downside to go before it finds a bottom.
A move higher from that 0.0246 to 0.0270 area would start to carve the right shoulder of what could be a massive inverse head and shoulders pattern.
Note too that it’s going to take a weekly close above 0.0405 to confirm the structure.
Disclosure: I have investments in Bitcoin, Ethereum, and VeChain.
[thrive_custom_box title=”” style=”dark” type=”color” color=”#fef5c4″ border=”fadf98″]
Want Me To Help You Become A Better Forex Trader?
Get a Lifetime Membership Today and receive exclusive member-only content including one to two new videos every day. Save 40% in October!
[/thrive_custom_box]


