NZDUSD has lacked direction for some time. Despite the impressive two-day rally that took place on March 16th and 17th, the risk-sensitive pair has struggled to find its footing.
In fact, the pair has been trapped in a broad range since bottoming in September of last year. But this swing low, as temporary as it may be, came at a price. NZDUSD lost 1,500 pips between April and September of last year and is currently down more than 2,000 pips from the July 2014 top.
So the big question for anyone interested in trading the New Zealand dollar vs. the US dollar persists – will the last seven months of consolidation lead to another selloff or is a major bottom in place?
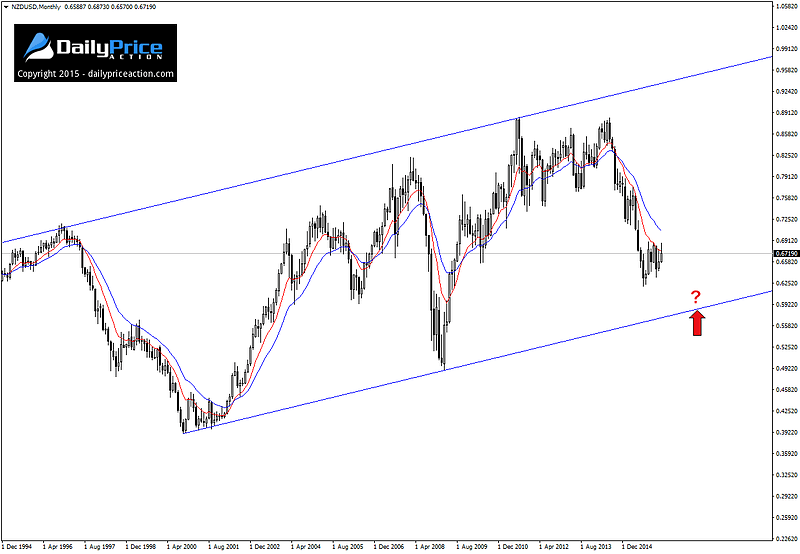
At the moment, it’s too soon to tell one way or the other. One thing we can learn about the pair, however, comes from the monthly chart.
The last twenty years of price action has been one giant ascending channel. With this in mind, and seeing that the pair last retested resistance in 2011, we can make a logical assumption that an eventual move toward channel support is the likely outcome.
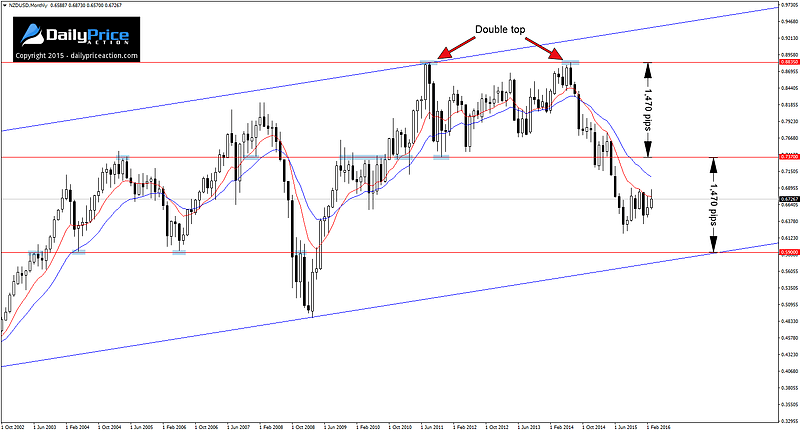
There is a second indication that the pair has yet to find a lasting bottom since the selloff began in 2014. The same monthly chart shows a double top that formed between 2011 and 2014. This formation has a 1,470-pip range.
However, since moving below the neckline, NZDUSD has only traversed a total of 1,180 pips, while the measured move of 1,470 pips offers an objective of 0.5900, just 30 pips below significant lows from 2004 and 2006.
Does this mean prices will drop another 780 pips from current levels?
In short, no. But it does, at least, hint at the idea that the pair may have to lose additional ground before a meaningful low can form.
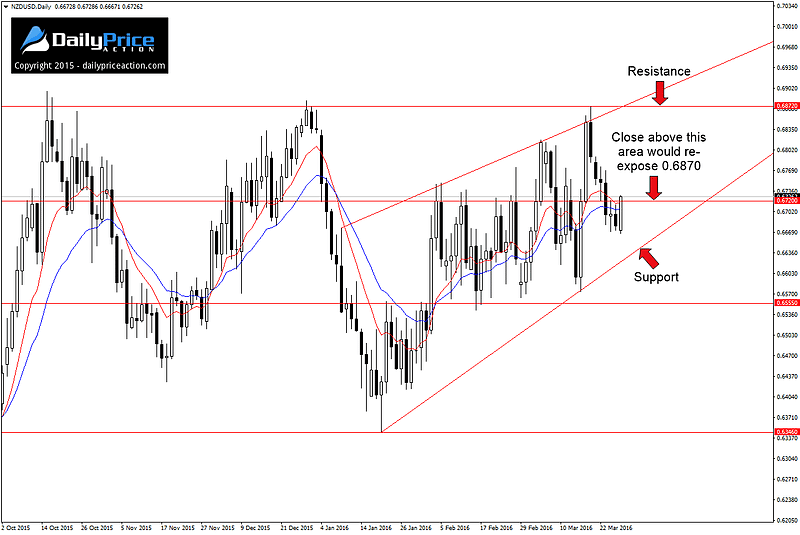
As for the short-term implications of all this, as long as we continue to see the current range persist, I have to favor the downside. At the same time, I’m keeping an open mind, knowing that anything can happen, especially in the volatile conditions of late.
One thing is indisputable – as long as the levels in the chart below remain intact, the pair will be going nowhere fast.


