On Sunday I mentioned the consolidation on gold may have come to an end last week.
Friday’s rally suggested that buyers were ready for the next leg higher.
I also wrote that a daily close above 1320 would secure the breakout and expose the next key resistance near 1350/60.
Some of you were a bit confused about how to play this one. But breakouts like this are incredibly straightforward.
I think the issue is that many traders tend to overthink things.
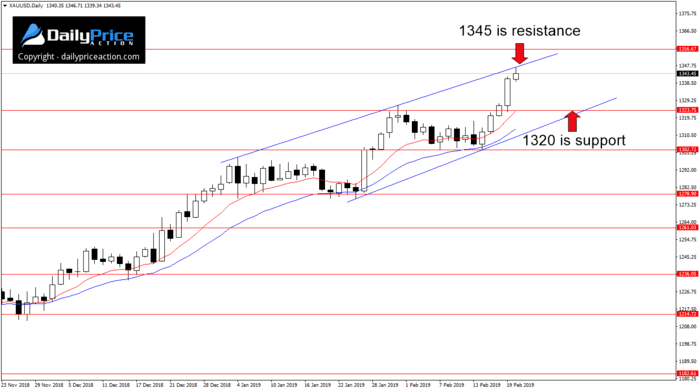
Monday’s 1326 close on gold confirmed the bullish breakout. And as you can see from the chart below, Tuesday’s session retested 1320 as new support.
It didn’t take long for gold bulls to get behind this breakout.
As I write this, the market is trading at 1343 and looks poised to attack the next key resistance area between 1350 and 1360.
But although I still think a test of the 1350/60 area is in the cards, there is a pattern developing that is a little worrisome for buyers.
The year-to-date wedge seen below suggests we’re nearing a top, at least in the short term.
That isn’t surprising given the multi-year range ceiling located just above 1360.
But this wedge has been in place for less than two months. That means it isn’t as convincing as it may appear at first glance.
Still, I think it’s worth keeping an eye on, especially as today is testing wedge resistance near 1345.
New York close charts are required for trading price action regardless of where you live in the world.
Click here to get access to the same Forex charts I use.
Gold remains a buy while above 1320. Resistance comes in at 1345 (wedge top) followed by the area between 1350 and 1360.
It’s going to take a daily close below wedge support near 1320 to turn this market lower.
[thrive_custom_box title=”” style=”dark” type=”color” color=”#fef5c4″ border=”fadf98″]
Save 40% on a Lifetime Membership to Daily Price Action – Ends February 28th!
Click Here to start profiting with Justin.
[/thrive_custom_box]


