[thrive_custom_box title=”” style=”dark” type=”color” color=”#fef5c4″ border=”fadf98″]
Important: I use New York close charts so that each 24-hour period closes at 5 pm EST.
Click here to get access to the same style charts I use on this website.
[/thrive_custom_box]
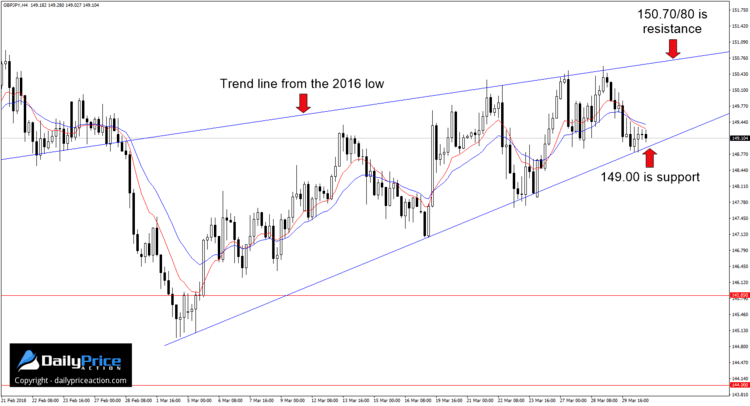
If you weren’t a believer in this GBPJPY 4-hour wedge pattern last week or even this past Wednesday, you probably are now. The past 48 hours has produced yet another retest of both resistance and support.
But before we get to the 4-hour chart, I want to draw your attention to the weekly time frame. The chart below will give you a better feel for why GBPJPY buyers are having trouble breaking above wedge resistance near 150.50.

Notice the break below long-standing trend line support in the last week of February. Since that close, we’re starting to see weekly candles with longer upper wicks, which illustrates the selling pressure that has surfaced along the former support level.
Since my last commentary, the pair has tested both support and resistance. In fact, just hours after I posted on Wednesday, buyers took the GBPJPY to 150.59 before slipping over the next 48 hours.
That slide lower tested support a few hours ago at 148.82. We can see how the GBPJPY has bounced slightly today, but the lackluster holiday volume isn’t likely to move the needle much.
The longer the risk-sensitive GBPJPY trades in this terminal pattern, the more explosive the resulting break will be. This is true for any ascending or descending structure but is particularly relevant to terminal patterns.
So, was Wednesday’s high of 150.59 all we’ll get before a break lower?
Perhaps, but as long as the pair trades above wedge support near 149.00, the possibility of a final push higher must be respected. As I mentioned on Wednesday, a retest of the 150.75 handle could be in the cards before buyers finally capitulate.
Then again, the pair could close below wedge support early next week or even today. Either situation (retest of 150.75 or close below wedge support) would trigger a selling opportunity for my part.
As for targets, the first key support below the 149.00 area comes in at 145.85. You could make the argument that the level is a bit lower toward 145.00, but 145.85 is holding on a daily closing basis (using a New York close chart).
Below the 145.00/85 area, we have 144.00 followed by 141.40. The latter would be my target following a close below wedge support.
Given the late February breakdown and the price action that’s followed, an eventual retest of 136.00 would not surprise me. Keep in mind, though, that a move of that magnitude would likely take several months to play out.
[thrive_custom_box title=”” style=”dark” type=”color” color=”#fef5c4″ border=”fadf98″]
Free Webinar: Learn how I trade pin bars, draw key levels, and much more!
[/thrive_custom_box]


