[thrive_custom_box title=”” style=”dark” type=”color” color=”#fef5c4″ border=”fadf98″]
Important: I use New York close charts so that each 24-hour period closes at 5 pm EST.
Click here to get access to the same charts I use.
[/thrive_custom_box]
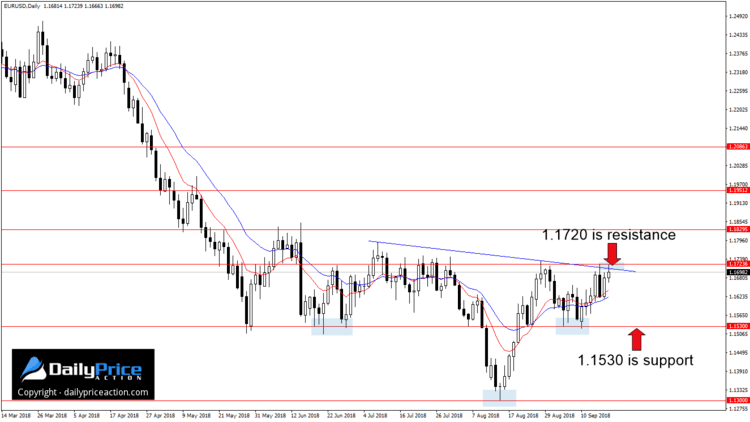
Over the weekend I pointed out how the 1.1720 area on the EURUSD would likely attract sellers if tested again this week. Less than 48 hours in, and the pair is already doing just that.
You can see how Euro bulls tested 1.1720 a few hours ago. And not surprisingly, they were met by a wall of sellers. Looking at the recent movement, I’d say there’s no question that 1.1720 is the level to beat.
However, you’re probably aware by now that I don’t pay much attention to intraday price action. Anything that happens before the New York 5 pm EST close doesn’t mean a whole lot in my experience.
That’s especially true when you’re dealing with a resistance area that isn’t quite as “clean” as you might like. That’s certainly the case with the 1.1720 region.
Before I talk about some of the levels I’m interested in, I want to address the mid-August bounce from 1.1300. You may recall the trade I took when the pair sold off from the 1.1620 area on August 8th.
If we view the movement before and after that decline to 1.1300, the EURUSD begins to take on the shape of an inverse head and shoulders pattern. The left shoulder formed in late June and the right shoulder developed earlier this month.
The neckline of this structure comes in a few pips below 1.1720. That’s all the more reason to keep an eye on that area.
With a height of approximately 440 pips, it puts the measured objective at the March 1st low near 1.2150. Of course, buyers would need to deal with resistance levels like 1.1830 and 1.1950 on the way up.
That may sound great for the Euro bulls out there, but keep in mind that until the pair clears 1.1720 on a daily closing basis, none of the above applies. In other words, as long as 1.1720 holds as resistance, the pair is range-bound with a floor at 1.1530.
To summarize, a daily close at 5 pm EST above 1.1720 would expose 1.1830 and perhaps 1.1950 while a decline from 1.1720 would encounter buyers at 1.1530.
[thrive_custom_box title=”” style=”dark” type=”color” color=”#fef5c4″ border=”fadf98″]
Want to Learn Step-By-Step How I Swing Trade the Forex Market?
Click Here to Register for the Free Webinar!
[/thrive_custom_box]


