Since the 2017 low, EURCAD has been trending higher.
However, it hasn’t been the most impressive rally, at least not since the pair topped out in March of last year.
For the last thirteen months, EURCAD has been moving sideways. The pair has even carved a few lower highs and lower lows along the way.
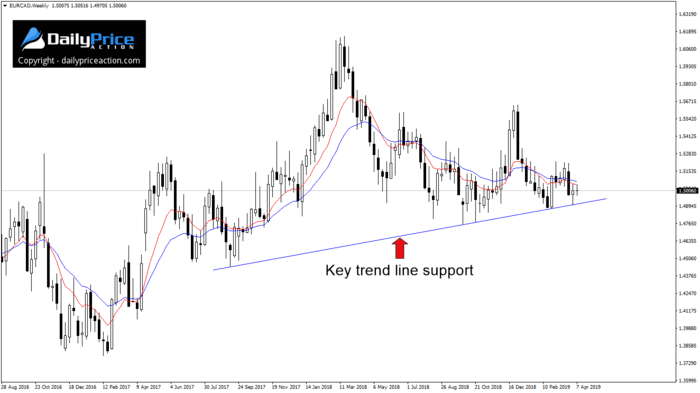
And if we study the price action since September 2017, we find a trend line that could be the difference between a higher EURCAD or a lower one in the coming months.
Here it is on the weekly time frame:

For those who have been trading for a while, you’ll notice right away that the shape is similar to a head and shoulders pattern.
I’m not convinced that it is one, though.
I prefer a head and shoulders to form after an extended move higher.
As it is, the head of the pattern includes prices that EURCAD visited in early 2016.
But that does not mean it won’t play out as a reversal pattern of sorts. Sometimes the more obscure and imperfect formations perform the best.
I do, however, think this trend line support needs to hold to keep EURCAD afloat.
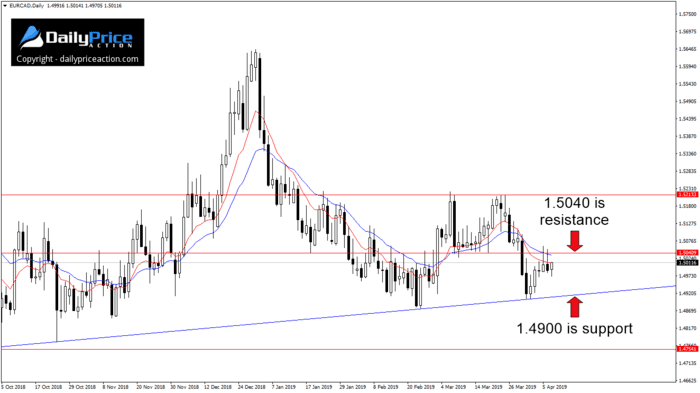
If sellers manage to break it on a daily closing basis, we could see EURCAD trend lower toward the 2018 low at 1.4750.
There is also a strong case to be made for a move to the trend line’s inception point. That would equal a move to the 1.4500 handle.
Alternatively, EURCAD buyers need to secure a daily close above 1.5040 resistance to alleviate some of the pressure.
Such a break would re-expose 1.5200.
I sold EURCAD on Monday at 1.5036 based on Friday’s bearish pin bar. I won’t add to the position until sellers can break trend line support just above 1.4900.
We’ll see if the consecutive bearish pin bars on Friday and Monday mean anything here.
I also announced this entry in the member’s area.
[thrive_custom_box title=”” style=”dark” type=”color” color=”#fef5c4″ border=”fadf98″]
Want to see how we’re trading EURCAD?
Click Here to join us and save 40% – Ends April 30th!
[/thrive_custom_box]


