AUDNZD has been a tough one to trade this year. Just when it looked as though the pair was on track to begin trending higher at the end of 2014, the bears came in with a vengeance and knocked prices down nearly 1,300 pips over the next six months.
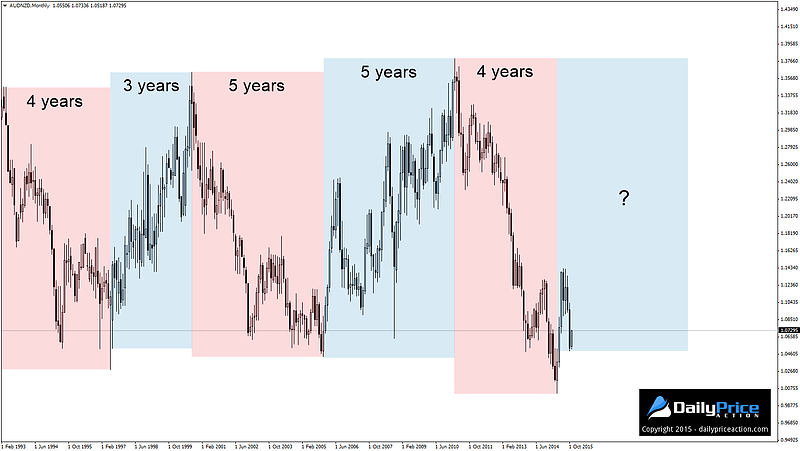
Despite this setback, AUDNZD remains one of the more cyclical crosses, rising and falling within three to five-year waves over the last twenty plus years.
A look at the monthly chart below shows five of these waves that have formed since 1993.
As you can see from the chart above, we are currently in the fourth year of the downtrend that began in April of 2011. Given the cycle that has been in place for more than twenty years, this hints at the idea that we are on the brink of another multi-year bull trend.
But will the April low at parity really hold up for the next seven or more years?
That is anyone’s guess. However the great thing about trading is that we don’t have to answer such questions in order to profit from favorable setups. Remember, trading is not about knowing what will happen, but rather using the clues the market gives you to help stack the odds in your favor.
For that we turn to price action. In the case of AUDNZD, we have a price structure that is unfolding on the weekly chart which may provide an additional clue as to where the cross is headed in the coming months.
Like any incomplete technical pattern, the structure shown in the chart below is merely something to keep on your watch list. It is not a prediction of what will happen nor is it something we would want to trade any time soon.
While traders could potential play the range here, I personally won’t be interested in AUDNZD until it clears the neckline of what could be an inverse head and shoulders pattern. This level comes in near 1.1400.
That may seem like a long time to wait for a trade to set up, and it very well could be. But given the pattern’s 1,300 pip measured objective and the fact that I have dozens of other currency pairs to trade in the meantime, I’m willing to wait.
Summary: Waiting to see which direction the pair chooses in the coming weeks and months. A move above the neckline of the potential inverse head and shoulders pattern would have us targeting a longer-term measured objective near 1.2750 (open to change if and when the pattern confirms).


Something worth following for multi years. Thanks Justin
Shaon, absolutely. It will certainly be on my watch list moving forward.
So it has to be a weekly close above the nick line to confirm the pattern. Am I right? If so do you recommend to wait for a retest on the weekly chart before entering the trade or is it ok to check for the retest on the daily chart? Thanks Justin
Fahad, a weekly close would certainly be more compelling, but isn’t absolutely necessary.