Finding favorable technical patterns is the cornerstone of how I trade. So when I can find two or more complementary patterns of the sort, I pay close attention.
As you may well know from the commentary on March 16th, AUDNZD has been carving out an inverse head and shoulders reversal since January of 2014.
Here is another look at the twenty-seven-month formation.
The bullish bias imposed by the structure above is a medium to long-term outlook for the pair given the fact that the neckline is more than 300 pips away from current levels.
So although the pair has weakened over the past few sessions, I haven’t entertained a short position, mostly due to the bullish implications of the pattern you see in the chart above.
In other words, I find it more favorable to watch for buying opportunities on dips than attempting to sell into rallies.
On the topic of dips, the pair is currently in the process of pulling back from the 1.1300 handle. And based on the 4-hour chart, I have a pretty good idea of where it may eventually find a bid.
But first, I want to share another technical structure I was tracking on the daily chart back in early March.
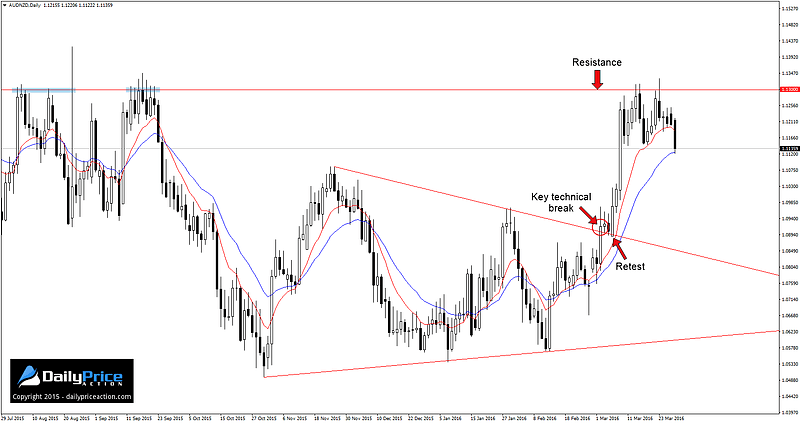
As you can see from the chart above, the pair broke wedge resistance on March 2nd and successfully retested the level as new support on March 4th and 7th before rocketing higher over the next three sessions.
So just like the inverse head and shoulders, this wedge has a bullish slant to it.
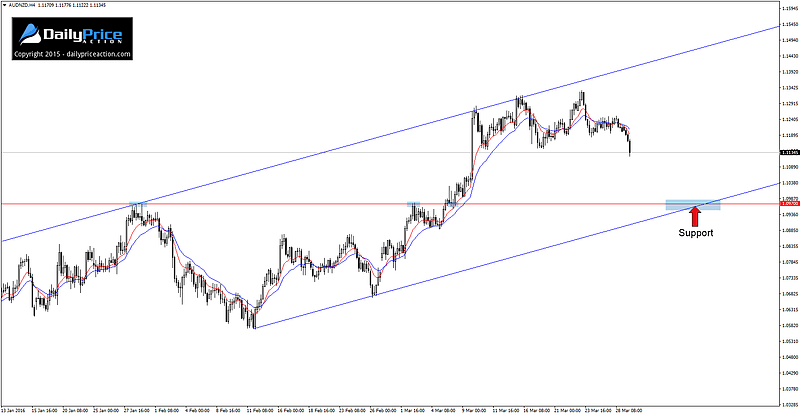
Now for the pattern I’m most interested in moving forward. The 4-hour ascending channel that extends from the February low has made its mark on several occasions since its inception in late February.
Seeing as how the pair just retested channel resistance in conjunction with the 1.1300 horizontal level, we could be in for a pullback to confluent support near 1.0970, a level that intersects with highs from late January and early March.


