Silver (XAGUSD) is knocking on the door of a bullish breakout.
I’ve discussed the bullish outlook for XAGUSD since it was trading at $18.21 on July 13th.
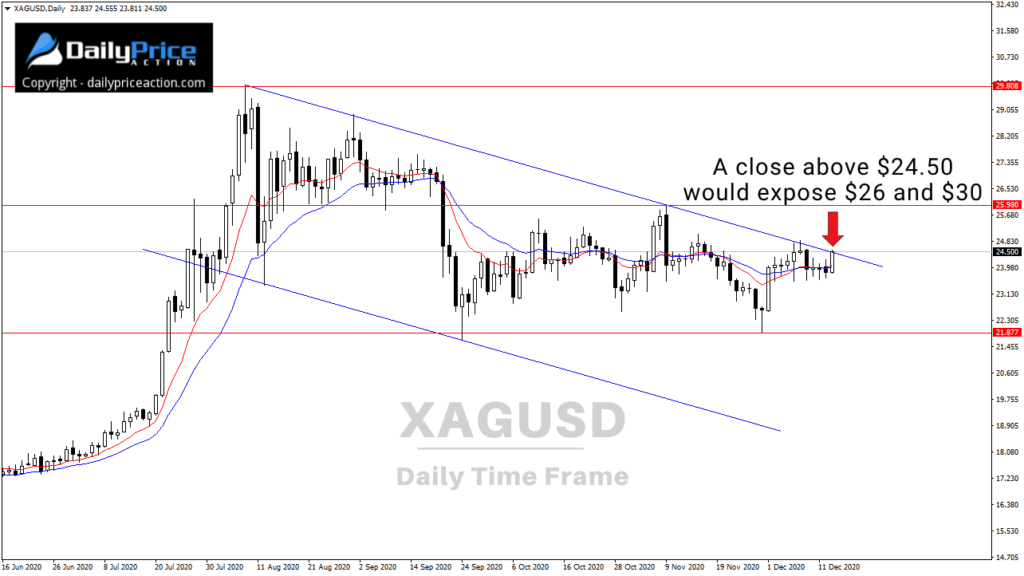
We’ve also been monitoring the bull flag pattern on the daily chart below (second chart) since October 13th.
All of that build-up may be about to pay off for buyers.
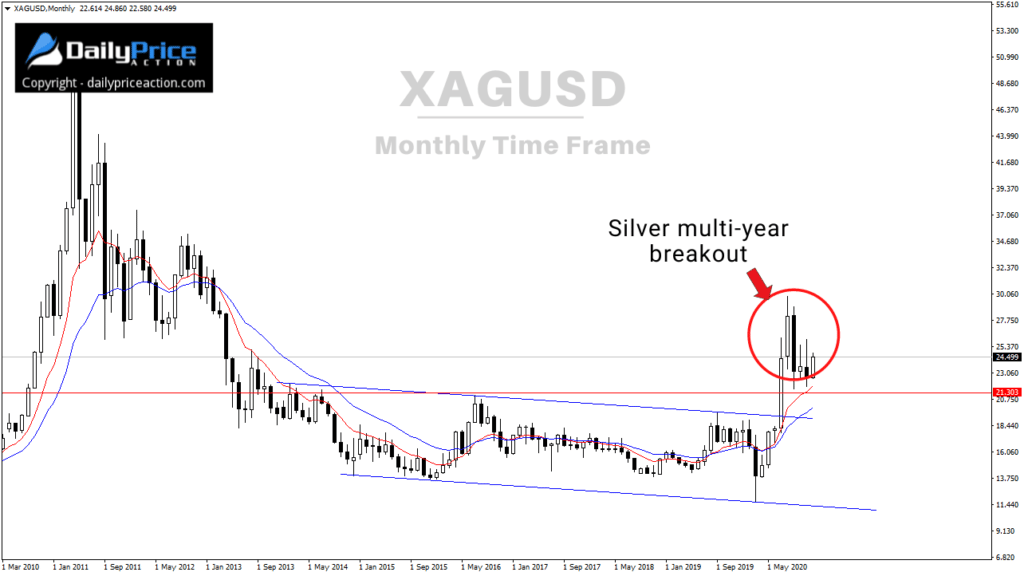
But first, let’s revisit the monthly chart for silver.

There’s no denying that 2020 has already been a big year for XAGUSD bulls.
After six and a half years of consolidating below the $22 area, silver finally broke out this past July.
And it was no ordinary breakout, either.
The six and a half years of coiling below $22 triggered a $17 move between July and August.
Then came the pullback.
Despite what some may think, XAGUSD pulling back from $30 to $21.60 over the last few months is perfectly normal and healthy.
It hasn’t even amounted to a complete 50% pullback, so no need to be alarmed.
All that said, XAGUSD bulls still have work to do.
Until silver produces a convincing daily close above $24.50, channel resistance remains intact.
The way the market continues to pressure channel resistance tells me a breakout isn’t far away.
Key resistance following a close above the $24.50 area would open the door to $26, followed by the recent high at $30.
As I mentioned on December 4th, this bull flag’s measured objective could send XAGUSD to $40 or higher in 2021.
[thrive_custom_box title=”” style=”dark” type=”color” color=”#fef5c4″ border=”fadf98″]
Want to Watch the XAGUSD Video I Just Released to Members?
Get a Lifetime Membership Today and receive exclusive member-only content including one to two new videos every day. Save 40% in December!
[/thrive_custom_box]


