The GBPAUD is starting to look interesting.
We’ve seen a lot of back and forth price action from the pair, but the recent (aggressive) selloff is what has my attention.
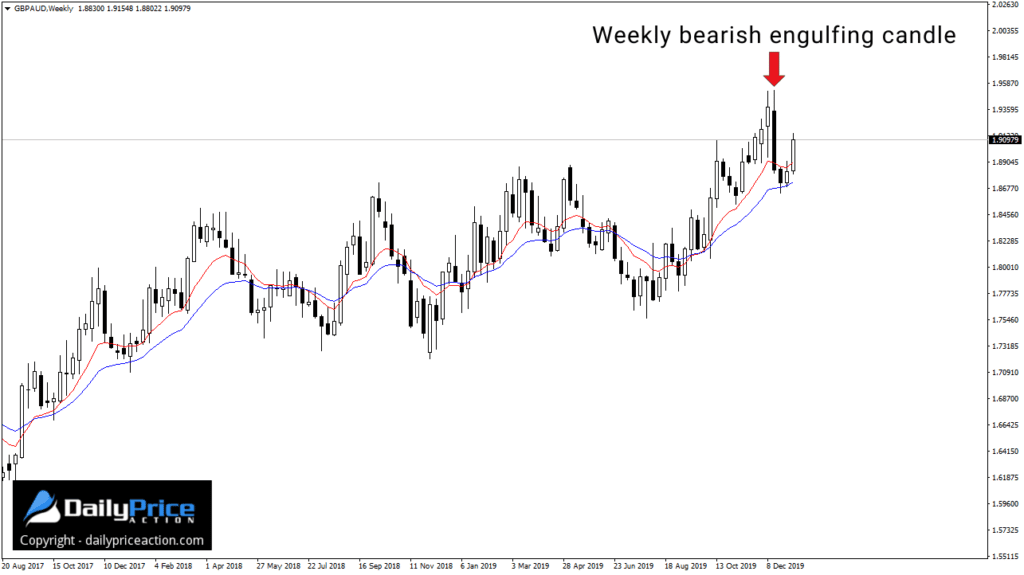
After reaching a multi-year high of 1.9521 on December 16th, the GBPAUD crashed hard.
So hard that it took just six sessions to erase 25 days worth of gains.
The result was a bearish engulfing candle on the weekly time frame, as shown in the chart below.

So far this week, the GBPAUD has reached the 50% retracement of the engulfing week above.
However, I’m more interested in what might materialize on the daily chart.
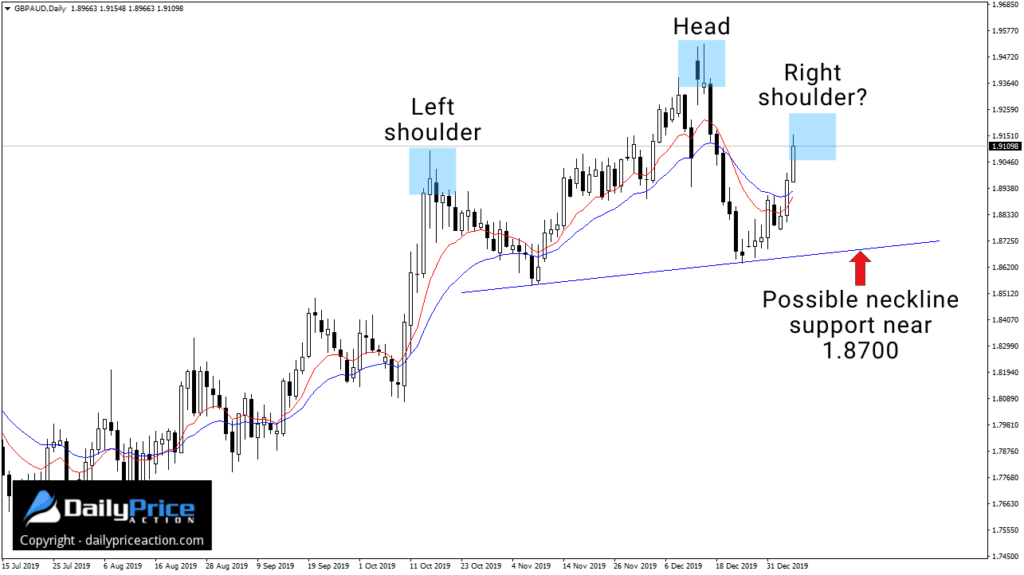
If we do see the GBPAUD start to rotate lower from the 1.9150 resistance area, we could have a head and shoulders reversal on our hands.
Notice the left shoulder that developed last October.
The head of the pending formation was that multi-year high in December.
But to call this a head and shoulders pattern, sellers need to secure a daily close below what would be the neckline near 1.8700 or thereabouts.
Given the 900 pip height of the pattern, a close below that 1.8700 area could open the door to the 1.7800 region.
Everyone who saw today’s members-only video knows why that 1.7800 area is significant for the pair.
Just keep in mind that there are no guarantees.
The GBPAUD uptrend is technically still intact, and without a daily close below the neckline, there is no head and shoulders reversal.
So for now, this is just one for the watch list.
[thrive_custom_box title=”” style=”dark” type=”color” color=”#fef5c4″ border=”fadf98″]
Want to watch the GBPAUD video I just released in the member’s area?
Get a Lifetime Membership Today and receive exclusive member-only content including one to two new videos every day. Save 40% in January!
[/thrive_custom_box]


