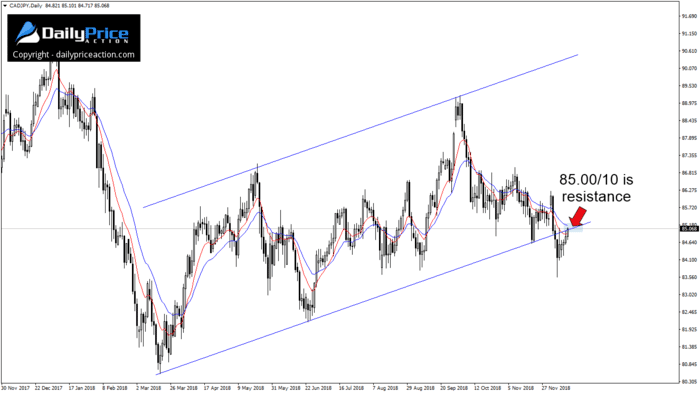
Last week I discussed a breakdown on CADJPY that could result in a 400-pip drop.
The ascending channel in question extends from the year-to-date low of 80.55. I first pointed out this pattern back on October 29th.
Sellers cleared (former) channel support at 84.90 on December 5th.
They quickly pushed prices to key support at 83.80, an area I’ve included on my chart for several weeks.
That area triggered a 150-pip bounce which tested former channel support as new resistance on December 7th.
As you can see from the chart below, that new resistance at 85.00/10 is once again under pressure.

It helps to keep things as simple as possible in times like this.
As long as CADJPY is below new resistance at 85.00/10 on a daily closing basis, the pair is vulnerable.
Alternatively, if buyers close the pair back above this level, it would reinstate the ascending channel and push CADJPY higher.
The key factor in either scenario is the daily close at 5 pm EST.
Go here to get instant access to the same “New York close” charts I use for trading price action.
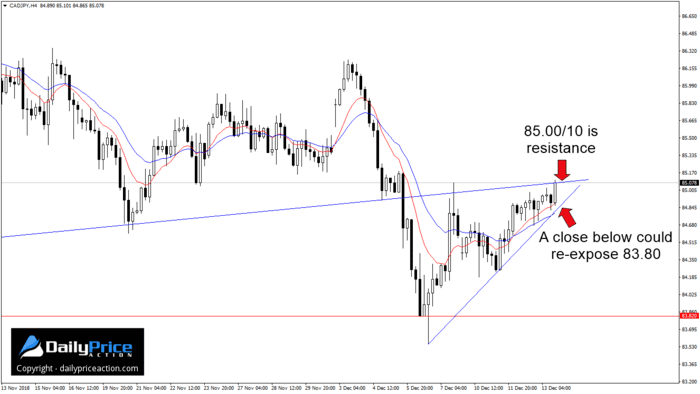
If you’re searching for a way to enter in the event of CADJPY weakness, there is an intraday level that might interest you.
Note how the pair has carved a short-term trend line support since forming the December 6th low.
A 4-hour close below this level would suggest sellers are ready for the next leg down.
Just remember that it’s going to take a daily close (not a 4-hour close) back above that 85.00/10 area to negate the bearish outlook.
The channel that broke down earlier this month took nine months to form. As such, it’s going to take a daily close back inside it to negate the breakdown.
I have no doubt we’ll be discussing this one in the member’s area as it unfolds.
But if I weren’t already in this one, I’d want to see if sellers can clear that short-term trend line before considering an entry.
Looking lower, key support remains 83.80. A daily close below that would expose 82.30 followed by the year-to-date low of 80.55.
[thrive_custom_box title=”” style=”dark” type=”color” color=”#fef5c4″ border=”fadf98″]
Save 40% on a Lifetime Membership to Daily Price Action – Ends December 31st!
Click Here to start profiting with Justin.
[/thrive_custom_box]


