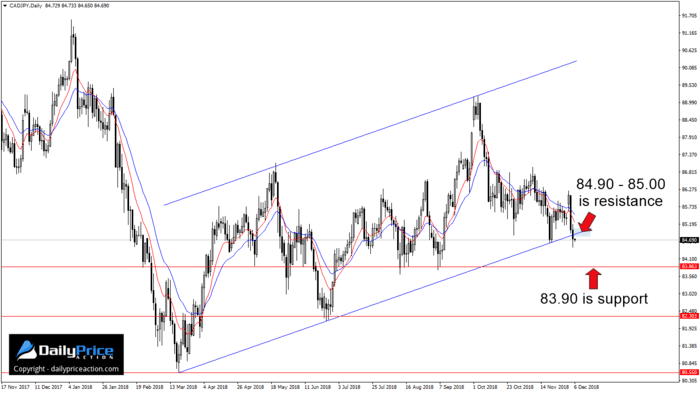
CADJPY sellers finally did it.
We have to go all the way back to October 29th to find the first time I mentioned this nine-month ascending channel.
And I didn’t mince words with the title of that post either. I called out the potential for a 400-pip drop if sellers could break support.
At the time, that support level was near 84.40, and CADJPY was trading at 85.80.
CADJPY bears had their work cut out for them with 140 pips between the current price and the level that needed breaking.
Fast forward to today, and the key level is closer to 84.90, and the pair just closed yesterday’s session at 84.73.
And that’s not just any breakdown.
This channel has directed price action for most of 2018. It also began at the year-to-date low of 80.55.
What’s the significance of that?
Simple. Markets love to retest the inception point of channels once broken.
In the case of CADJPY, that inception point is 80.55.
That doesn’t mean the pair will reach that level. But it does give us an idea of the vast potential here.
And for anyone doubting the validity of this channel, take note of the bounce between the 20th and 21st of November.
That’s about as precise as you can get.
It further validates the significance of this 2018 channel as thus yesterday’s breakdown.
I’m already short CADJPY as of yesterday. I mentioned my entry and target in the member’s area when the pair was still above channel support.
From here, a rotation higher into the 84.90 – 85.00 area will likely encounter an increase in selling pressure.
As I mentioned on October 29th and again on November 20th, key support comes in 83.90 and 82.30. Of course, don’t forget the year-to-date low at 80.55.
Alternatively, a daily close back inside this ascending channel would negate the bearish outlook.
[thrive_custom_box title=”” style=”dark” type=”color” color=”#fef5c4″ border=”fadf98″]
IMPORTANT: I use New York close (5 pm EST) charts for trading price action.
Click here to get access to the same charts I use.
[/thrive_custom_box]


