[thrive_custom_box title=”” style=”dark” type=”color” color=”#fef5c4″ border=”fadf98″]
Important: I use New York close charts so that each 24-hour period closes at 5 pm EST.
Click here to get access to the same charts I use.
[/thrive_custom_box]
Last Sunday’s forecast came with a warning about buying U.S. crude oil. The market was trading at 74.20 at the time, and despite a rather aggressive uptrend since early 2016, I didn’t like the look of the price action since February of this year.
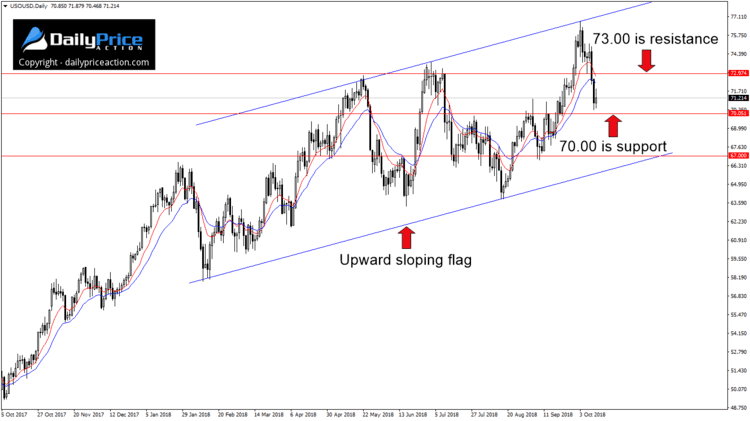
An ascending channel (second chart) that develops on the back of a multi-month rally is an exhaustion pattern. The lesser-known upward sloping flag is similar to a rising wedge in that it suggests buyers are tiring.
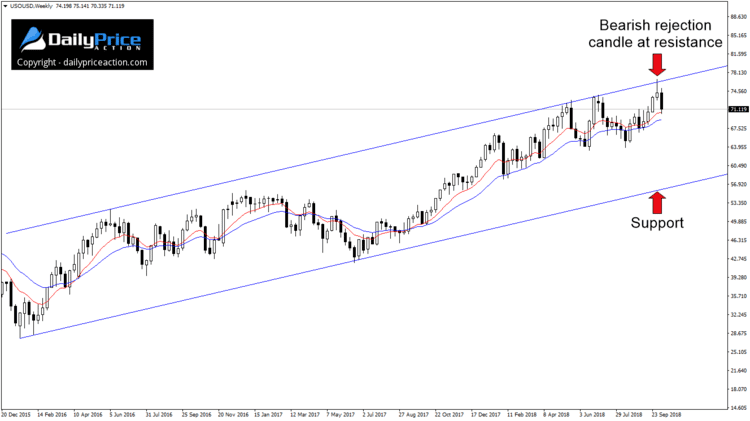
If that wasn’t enough to convince you a pullback was likely, I also posted a weekly chart showing a much larger channel.

Not only did the market test the ceiling of this multi-year channel last week, but it also carved a bearish rejection candle as a result. So between the daily and weekly time frames, it was pretty clear where the market wanted to go this week.
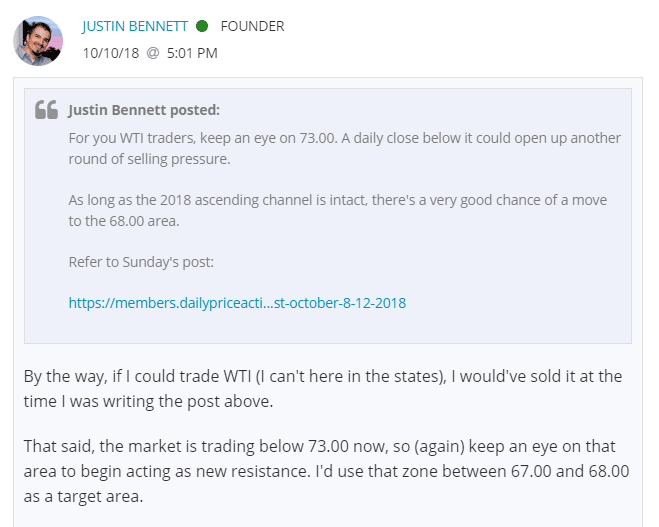
I even commented in the member’s area how the close below 73.00 on Wednesday would likely attract additional selling pressure.
Here’s what I wrote a few days ago in the private community:
Mind you, I can’t even trade this market here in the states, so all of this was for those of you outside the U.S. to take advantage of this pullback.
In the post above I pointed out the area between 67.00 and 68.00 as a target for shorts. That area is the intersection of several highs and lows since April as well as channel support that extends from the year-to-date low.
However, there’s also good reason to suspect an influx of buying pressure at the 70.00 handle next week. You’ll notice right away that this area served as a key pivot starting in mid-July.
Alternatively, a bounce higher would likely encounter sellers near 73.00. The area helped cap the advance in May and again in June/July.
For the longer term, the ascending channel suggests crude oil will remain under pressure for some time. And if support near 67.00 breaks down, we could see the market trend toward the June and August lows at 64.00.
Note: There are two ascending channels here. The one above occurs on the weekly chart and dates back to 2016. The one below is on the daily time frame and dates back to February of this year.
[thrive_custom_box title=”” style=”dark” type=”color” color=”#fef5c4″ border=”fadf98″]
Save 40% on a Lifetime Membership to Daily Price Action – Offer Ends October 31st!
Click Here to start profiting with Justin.
[/thrive_custom_box]


