A strong start to last week fizzled relatively quickly for the EURUSD. Although the pair managed to close above the 1.1200 handle during Tuesday’s session, the surge was short-lived as the next three days combined for a total loss of 170 pips.
Identifying actual false breaks can be challenging. However, given the prominence of 1.1200 since the middle of last year, I’m inclined to believe that Tuesday’s price action was indeed a false move above resistance.
Also, false breaks are often followed by a sharp move in the opposite direction, which fits the description of the final 72 hours of last week.
But even if that’s true, we still need to respect the technical levels in front of us. And Friday’s late-session bounce was the result of one such critical level at 1.1060, an area that should offer some guidance to start the new week.
As long as 1.1060 holds on a daily closing basis traders must respect the potential for a move back to 1.1200. On the other hand, a close below the level would expose the July low at 1.0950.
Want to see how we are trading these setups? Click here to get lifetime access.

Similar to EURUSD, GBPUSD kicked things off with a push higher but ended the week lower by 160 pips after the Bank of England announced its decision to cut interest rates.
At the moment, the July 26th low at 1.3050 seems to be the only thing preventing the pair from sliding lower. But given the way the pound has positioned itself against the US dollar, I wouldn’t be surprised to see a close below the level in the coming sessions.
Such a break would target the post-Brexit low at 1.2790 with a move below that exposing a level that dates back to 1984 at 1.2500.
I’m on the sidelines for now but will be keeping a close eye on how the pair responds to 1.3050 in the coming week.

Despite its best effort, AUDUSD was unable to break the confluence of resistance at 0.7650 last week on a daily closing basis.
That said, I’m not interested in shorting the pair just yet due to the surge of higher lows into resistance since the May low was carved out near 0.7160.
I’m more interested in seeing a close beyond the current range. As pointed out in the chart below, the upper and lower boundaries that form that range are 0.7650 and 0.7500.
Want to see how we are trading these setups? Click here to get lifetime access.

NZDUSD turned lower last week after the 300 pip rally tested a critical pivot at 0.7255. The confirmed break from the ascending channel came early in Wednesday’s session and indicated that buyers were starting to fatigue.
Although the pair recovered more than anticipated, Friday’s price action is indicative of a market that is likely to see further losses in the coming sessions.
Not only did NZDUSD slide 80 pips in the final nine hours of trade, but it also closed the week below the 0.7144 handle, a level that previously acted as support during Wednesday’s session.
From here we could see some consolidation take place before the next leg lower materializes. However, as long as 0.7144 holds on a daily closing basis, the downside risk remains elevated with the first level of support coming in at 0.7080.
Note that the Reserve Bank of New Zealand rate decision is this Wednesday at 5 pm EST, so be sure to plan your trades accordingly.

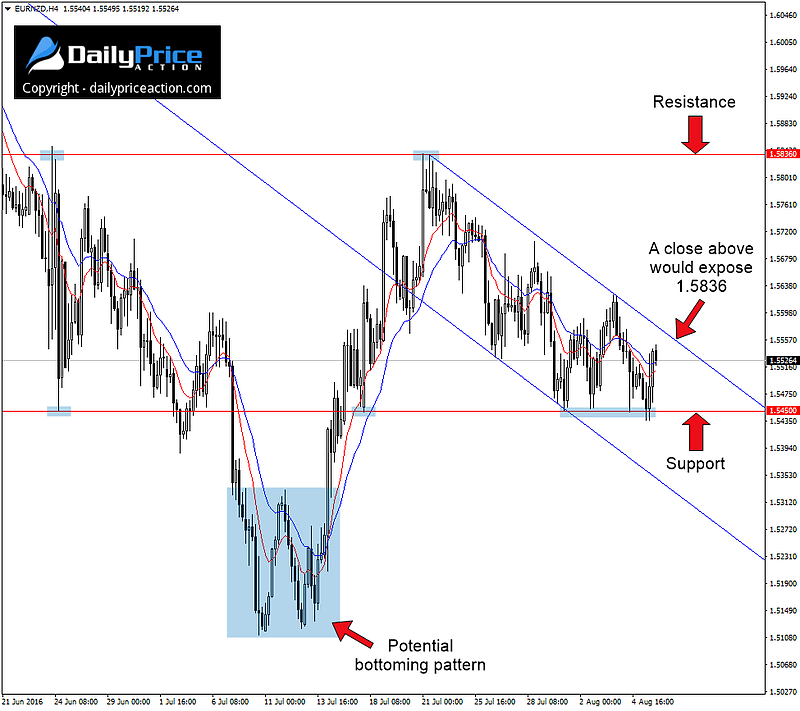
Provided the New Zealand dollar continues to weaken, one currency cross that has a ton of upside potential is EURNZD.
I gave a more detailed explanation of circumstances on Friday, but the general idea here is that the latest rally that began in mid-July appears to be impulsive.
However, as I also mentioned on Friday, having suspicions about a particular market structure is not enough to justify putting capital at risk.
To help add conviction to this idea is the 4-hour descending channel that extends from the July high at 1.5836. This consolidation pattern could offer a hint as to the timing of the next leg up if one is to materialize.
A close above channel resistance would expose 1.5836 with a break above that targeting the measured objective near 1.6160.
Use extra precaution when timing your entry as Wednesday’s RBNZ decision will almost certainly trigger an increase in volatility along with unfavorable spreads for the EURNZD.
Want to see how we are trading these setups? Click here to get lifetime access.


