EURUSD has jumped to the top of my watch list this week. After plunging 520 pips following the June 24th Brexit vote, the pair has now managed to retrace 50% of that move. It’s also no secret that the recent relief rally appears corrective in relation to the late June selloff.
As for technical levels, the June 24th close placed the single currency below channel support that extends from the December 2015 low on a daily closing basis. And with the pair now reaching toward former support as new resistance, we could see a favorable short opportunity develop in the week ahead.
But as always, I will wait for a clear price action signal before committing to a position, which could very well materialize near the 1.1200 handle. Immediate support comes in at 1.1060.
Want to see how we are trading these setups? Click here to get lifetime access.

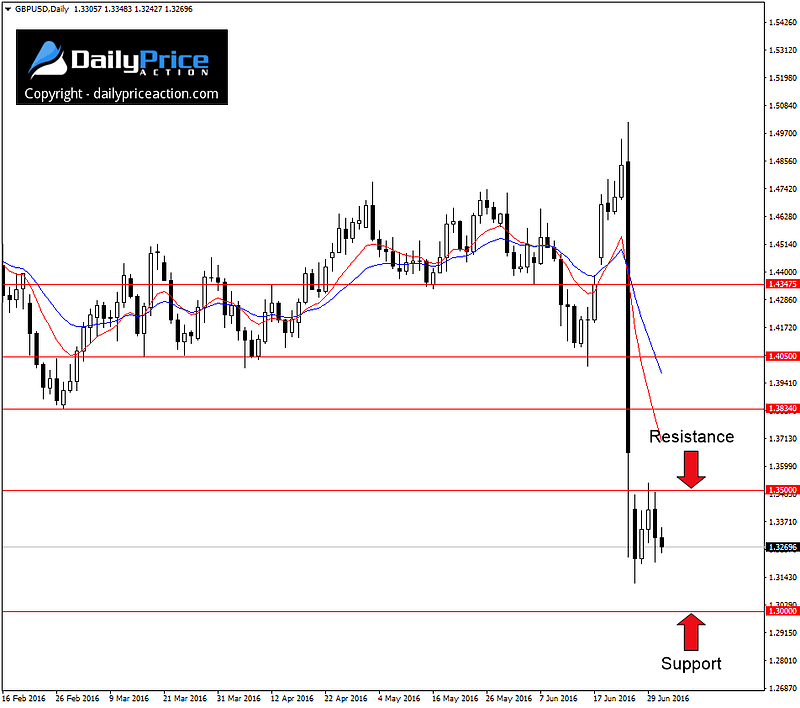
GBPUSD remained under pressure last week giving up an additional 250 pips from the highs, so no surprise there. The pair continues to struggle at the 1.3500 handle, which is a level that I mentioned in the previous forecast.
The post-Brexit woes are expected to keep prices suppressed for some time, but the volatility and overextension of late have kept me on the sidelines. It will probably be some time before I feel comfortable taking a position in the British pound given how unstable the price action has become.
In the week ahead, the 1.3500 area should continue to serve as resistance while a bid could develop near last week’s lows of 1.3120. However, the next critical level of support doesn’t come in until 1.30.

USDCHF is a pair I haven’t mentioned for some time as it’s one that I rarely trade. However, the descending channel that has directed price action thus far in 2016 has started to catch my attention in recent weeks.
One reason I’m partial to the pattern is that it’s in line with my bullish bias from January, a bias which has no doubt taken its time in coming to fruition.
Any further weakness from current levels is likely to find a supportive bid near 0.9660. With that said, I won’t consider trading USDCHF until we see a close above channel resistance near 0.9820.
While the structure still needs some time to develop before it can be regarded as tradable, it’s certainly one to keep an eye on in the weeks and months ahead.
Want to see how we are trading these setups? Click here to get lifetime access.

NZDUSD bulls have their work cut out for them this week. Despite last week’s gain of 180 pips, the pair failed to close above the confluence of resistance near 0.7200 on a daily closing basis.
I’ve mentioned this area several times in recent weeks as it’s the intersection of channel resistance from October of 2015, lows from February and March of last year as well as the 38.2% Fibonacci retracement from the 2014 high to the 2015 low.
But that doesn’t mean this is a selling opportunity, at least not yet. The pair is still carving out higher highs and higher lows on the intraday charts and hasn’t shown any signs of stopping just yet.
Speaking of signs, a pattern has emerged on the 1-hour chart that could act as an early warning sign should buyers begin to capitulate.

The 1-hour ascending channel you see above has been developing since the June 27th lows, just days after the momentous Brexit vote. While its existence doesn’t mean that the pair will weaken from current prices (nothing would as there are no guarantees), it does give us an area to watch should sellers begin to tilt the scale in their favor.
And although a close below channel support could offer a favorable opportunity to get short, it seems a larger opportunity might materialize with a daily close below the 0.6986 handle.

I mentioned EURJPY on Friday, noting that a confluence of resistance lies just above current prices at 115.50. This is both the 61.8% Fibonacci retracement from the 2012 low to the 2014 high as well as trend line resistance that extends from the February 2014 low.

Whether the pair manages to rally 130 pips this week to retest the 115.50 handle as new resistance is anyone’s guess. But we may not need to wait that long to find a material weakness in the yen cross.
Much like the NZDUSD channel we just discussed, the ascending price structure on EURJPY has been in place since the June 27th low. And although Friday’s price action started to look a bit “heavy”, channel support managed to hold its ground into the close.
In the week ahead, traders can watch for a close below the lower boundary of the channel which would open the door for a retest of the 111.35 support level followed by the post-Brexit low of 109.20.
Want to see how we are trading these setups? Click here to get lifetime access.


