A quick glance at the docket for the upcoming week hints at a slow start. However, continue reading down the page and it becomes apparent that the second half of the week will be anything but slow starting with FOMC on Wednesday.
One pair that naturally has everyone’s attention is EURUSD. Is the pair on the cusp of a major rally or is this just another relief rally that will flounder under continued selling pressure?
The answer to that question remains elusive, but if I had to wager a guess I would say that the upcoming trading week will provide us with a major clue.
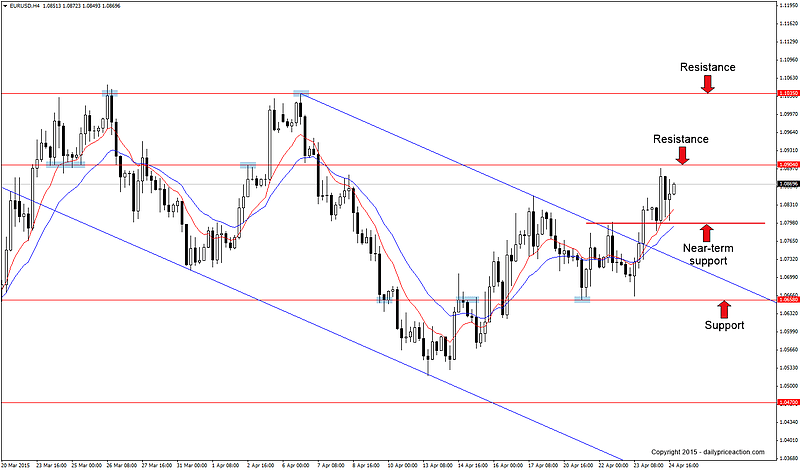
Last week the bulls managed to break channel resistance that is best seen on the 4 hour chart. This level had held since April 6th, rejecting buyers on three separate occasions.
Now that this level is broken we can turn our attention to horizontal support and resistance that will play a role in the week ahead. In the immediate vicinity of last week’s close we have support at 1.0800 and key resistance at 1.0904.
The market is too close to resistance to justify buying and too close to support to justify selling. That said, with last week’s break of channel resistance the upside does look to be the more favorable option over the coming sessions.
Summary: Standing aside for now. A daily close above 1.0904 could trigger a rally to 1.1035. Break that and we could see a much larger rally develop over the coming weeks. Alternatively, a daily close back below 1.0800 would see the 1.0658 support level come into play once more.
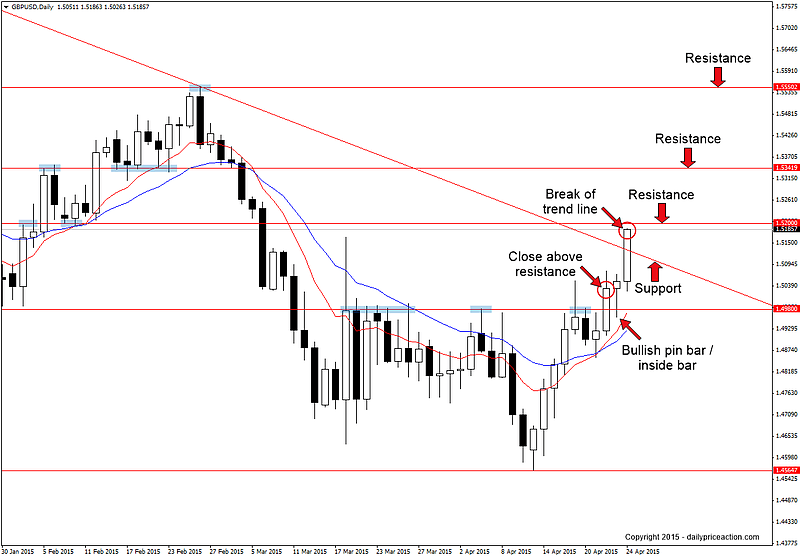
In similar fashion to EURUSD, GBPUSD also broke free from resistance to end the week. But just like its counterpart, the British Pound is caught in a narrow range of support and resistance. This leaves us in “wait and see mode” for the time being.
The pair managed to break trend line resistance that extends off of the 2014 high at 1.7190. Under most circumstances, a break such as this would have us watching for bullish price action on a retest of the level as new support.
The challenge with that approach here is the fact that the 1.5200 key level is less than 100 pips away from what would be trend line support. This leaves us waiting for a daily close above 1.5200 in order to secure a more favorable risk to reward ratio.
Summary: Wait for a daily close above 1.5200 and then watch for bullish price action on a retest of the level as new support. Key resistance from there comes in at 1.5342 and 1.5550.
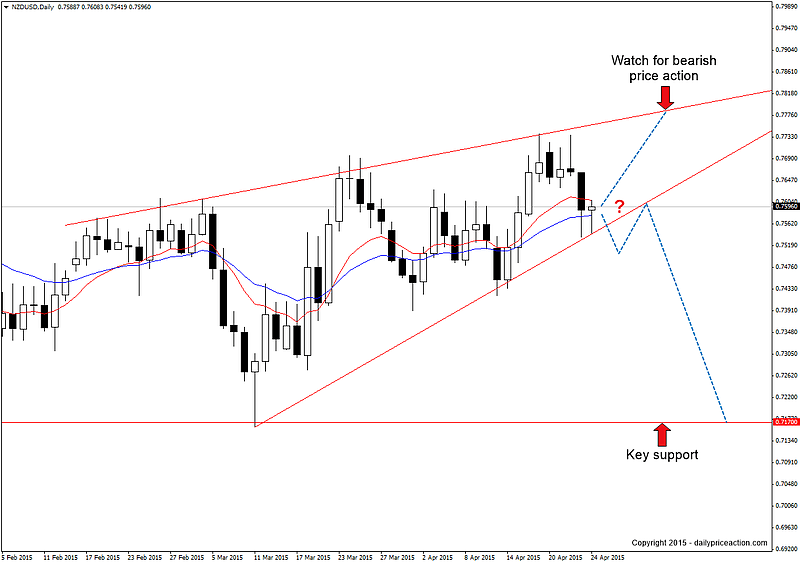
NZDUSD hasn’t been much of a performer over the past several months. After falling 700 pips to start the year the pair has been consolidating into what now appears to be a rising wedge pattern.
Such a pattern in the midst of a downtrend generally signals a continuation of the preceding trend. But as we all know, the only thing that matters is what the market decides to do. And to better understand the market’s intentions we need to wait for a valid signal.
Remember that in situations such as this it’s important for us to let the market make the first move. This pattern may come with bearish connotations but given recent USD weakness NZDUSD could just as easily break to the upside.
Summary: If the pair finds support this week at .7550 we can watch for bearish price action on a retest of wedge resistance. Alternatively, a daily close below wedge support would have us watching for a retest of the broken level as new resistance.
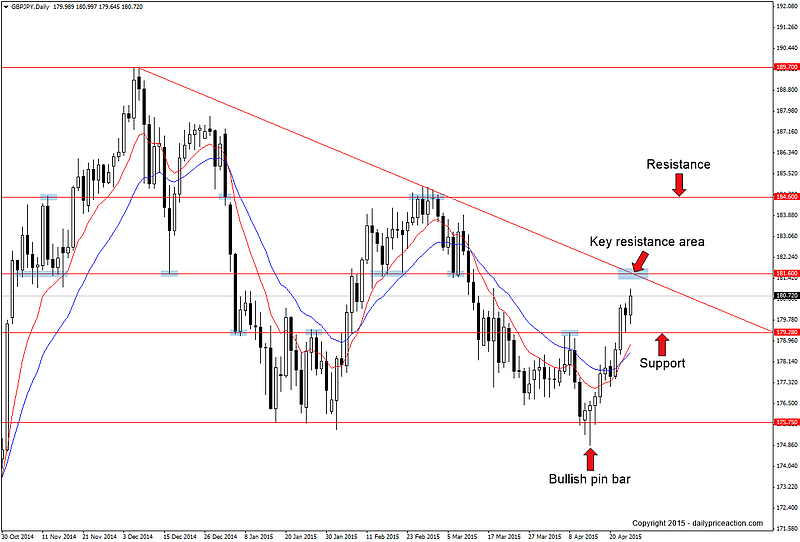
GBPJPY is one that I will be watching with a lot of interest over the coming week. Although there isn’t much for us to do at the moment, the pair is coming into a key inflection point that is represented by trend line resistance from December of 2014 and the 181.60 key handle.
From here we can watch for one of two things. Bearish price action at this area would have us looking lower to the 179.28 level. Alternatively, a daily close above 181.60 could trigger a move to the next resistance level at 184.60.
I would prefer to see a break higher purely from a risk to reward standpoint. A triangle pattern such as this within the context of a broader rally generally signals an eventual break to the upside. But it’s important for us to remain patient and wait for a valid signal before risking any capital.
Summary: Standing aside for now. A daily close above 181.60 would have us watching for bullish price action on a retest of the level as new support. Alternatively, bearish price action at the 181.60 key inflection point would have us looking lower to 179.28.
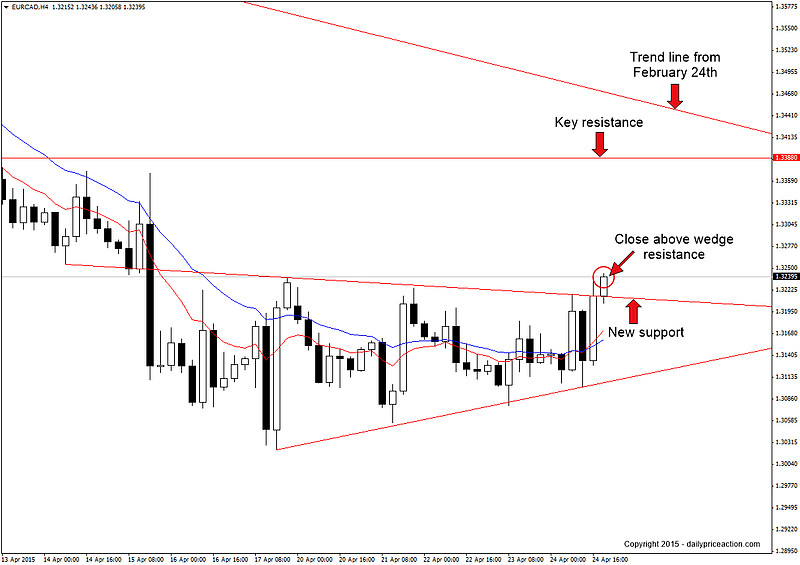
Next up are the two CAD pairs that we were watching late last week. Let’s start with EURCAD.
I first mentioned this wedge pattern on Thursday of last week. It should be noted that the upper level has been modified based on Friday’s price action.
The bulls made a late chart during Friday’s session, closing the week above wedge resistance. This leaves us watching for a buying opportunity on a rotation lower to retest the level as new support.
Any bullish price action at this level should leave us with a healthy risk to reward ratio. The next key level of resistance comes in at 1.3388, giving us 180 pips to work with.
The 1.3388 level is also the 50% retracement from the April 6th high to the April 17th low, further supporting the idea that a revisit to this level is likely over the coming sessions.
Summary: Watch for bullish price action on a retest of former wedge resistance as new support. Key resistance and measured objective comes in at 1.3388.
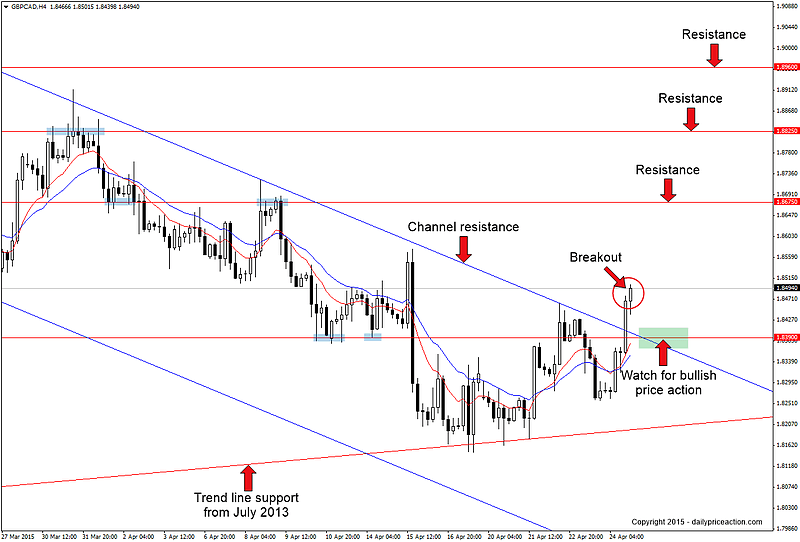
Last but certainly not least is GBPCAD. I may have saved the best for last with this one as the pair manged to break a two-month descending channel during Friday’s session. The channel in question can be seen extending back to the February 24th high.
The technical catalyst that ultimately led to the breakout was trend line support from July of 2013. This level can be seen acting as support several times over the better part of two years.
With this break we can begin watching for bullish price action on a rotation lower to retest the 1.8390 level as support. This level is better illustrated on the daily chart and can be seen acting as resistance during December of last year and more recently as a key support and resistance level during the month of April.
Key resistance areas to keep an eye on for the week ahead include 1.8675, 1.8825 and 1.8960. Each of these areas can be seen playing a significant role since the beginning of the year.
Summary: Watch for bullish price action on a retest of 1.8390 as new support. Key resistance comes in at 1.8675, 1.8825 and 1.8960.

