Is GBPUSD about to break free from 1.3580 resistance? And can the DXY hold 97.70, or will the dollar break down to test 96.70 support?
Watch today’s video for my full breakdown, including the key levels I’m watching and what they could mean for the days ahead.
GBPUSD Analysis
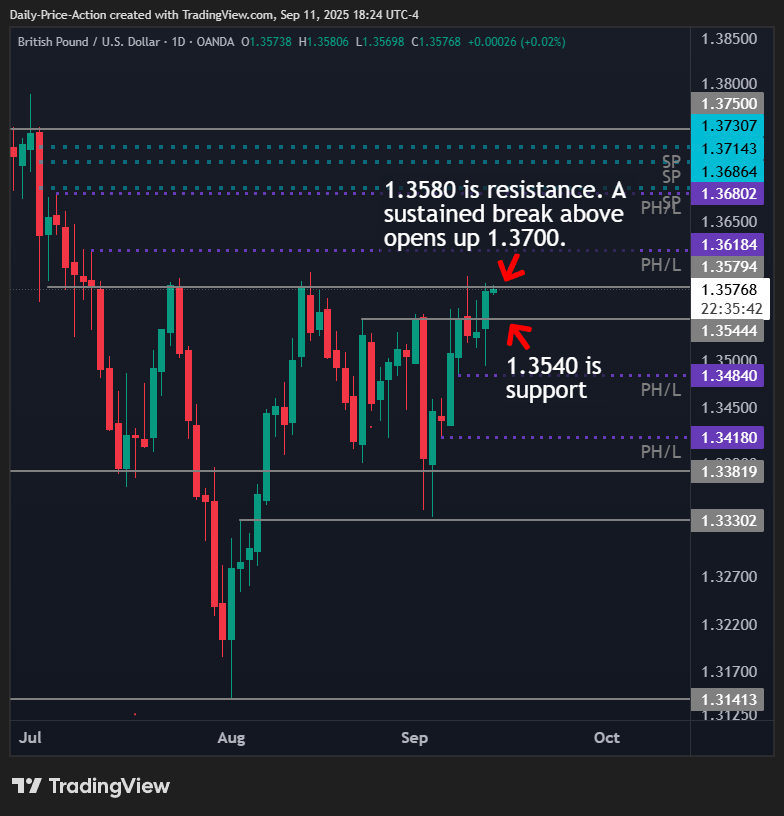
GBPUSD is testing key resistance at 1.3580 today after the ECB decision and US CPI numbers.
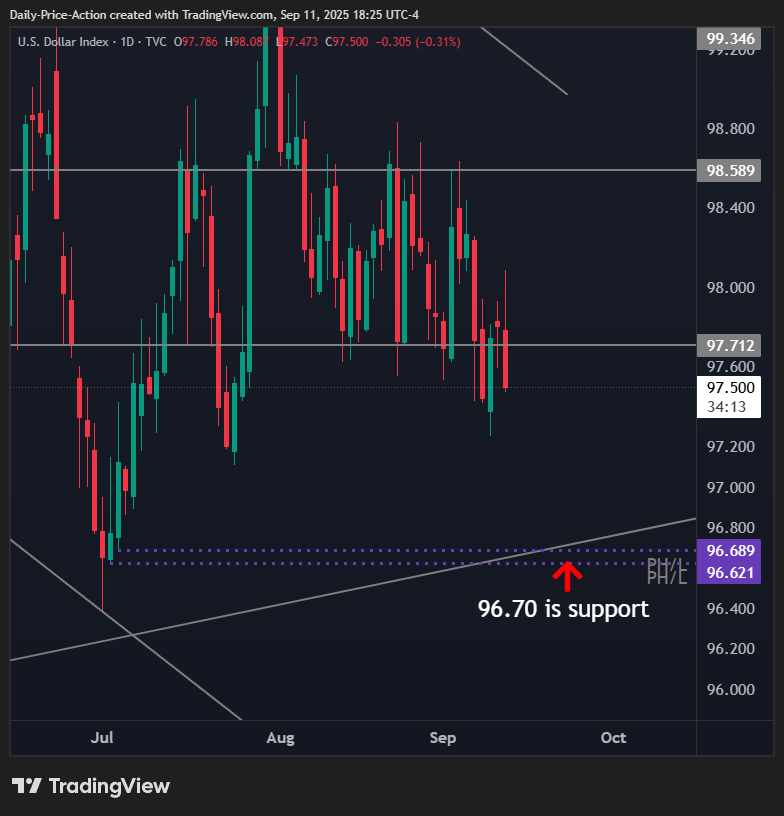
The DXY showed strength earlier in the week, closing back above 97.70, but dollar bulls seem to be fading again.
If GBPUSD can secure a daily close above 1.3580, the pair may push into the 1.3700 region later this month. There are several imbalances from July sitting above 1.3700 that could pull prices higher.
That said, as of now, GBPUSD is still trading below 1.3580, which keeps longs off the table.
The DXY could also make a run at the poor lows near 96.70, levels we’ve discussed in recent videos. Markets often revisit unfinished auctions, so 96.62 and 96.69 could come under fire later this month.
But that’s far from certain. Right now, GBPUSD is pressing into 1.3580 resistance, and buying into resistance is rarely a good idea.
Overall, the forex market has been challenging to trade since August. The sideways range and indecision have made conditions tricky for the pound and most major pairs.
Join us in the VIP Discord group for real-time updates on GBPUSD and other markets, which includes VIP-only videos, my trades in real time, and the complete trading course.

DXY Analysis
The US Dollar Index (DXY) is sitting at a critical spot this week.
Thursday’s close will decide whether 97.70 flips from support to resistance. If buyers can’t defend that level, it turns into resistance and leaves the dollar exposed.
On the flip side, key support comes in at 96.70. That area also aligns with the poor lows we’ve discussed in recent videos. Markets often revisit those unfinished auctions, so a run at 96.70 later this month wouldn’t be a surprise.
My playbook here is simple.
A daily close below 97.70 keeps pressure on 96.70 and those poor lows. But if the USD index can reclaim 97.70 into the close, dollar bulls may have more room to work with.
I’m less confident the dollar can reclaim 97.70 in the next few hours, given the price action so far on Thursday.
As always, confirmation matters. Buying into resistance or selling into support is always ill-advised. It’s always best to wait for confirmation and then react accordingly.
For now, the DXY is on the edge. Lose 97.70, and 96.70 comes into focus. Hold above it, and the range sticks around a little longer.
Join us in the VIP Discord group for real-time updates on GBPUSD and other markets, which includes VIP-only videos, my trades in real time, and the complete trading course.


