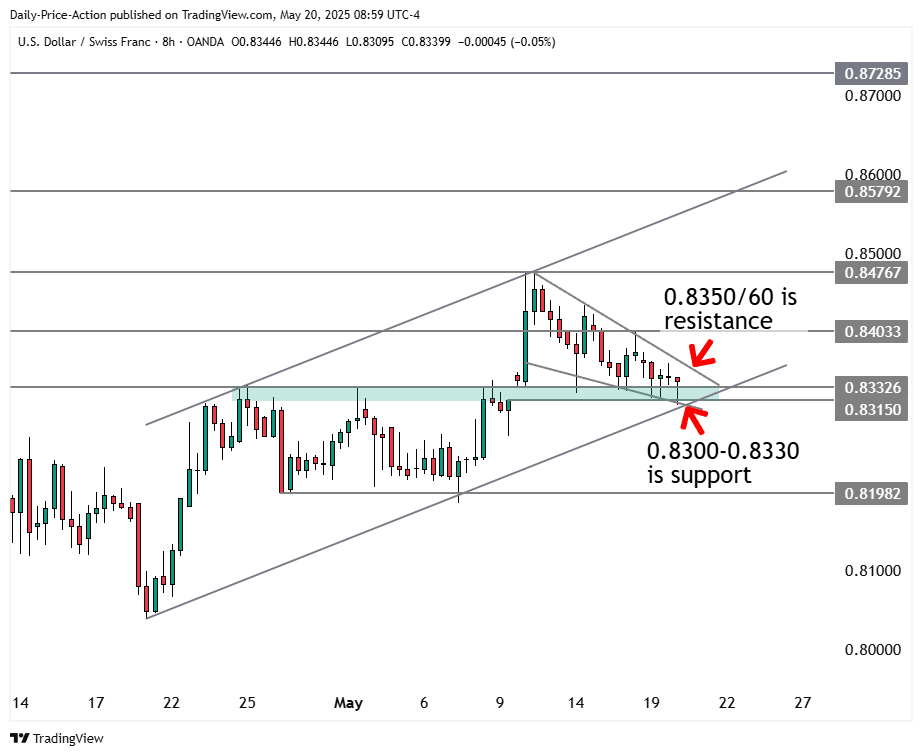
USDCHF is coiling for a breakout. The question is, which way is it likely to break?
Watch today’s video below for all of the details. I’ll share the key levels and patterns to watch, the USDCHF scenario I think is most likely, and my targets.
USDCHF remains sideways, finding support at 0.8330 and resistance at 0.8475. I discussed this range and possible scenarios in the Weekly Forex Forecast.
However, despite the lack of follow-through, USDCHF is starting to look more appealing. The pair has coiled into a potential falling wedge above 0.8330. Within the last 24 hours, it also closed the weekend gap at 0.8315.
The question now is, can USDCHF bulls break the 0.8350/60 area? That’s the descending trend line from the May 12th high. It’s also the top of the falling wedge.
USDCHF will start to look more bullish if it can break that trend line resistance. Considering how sideways markets have been this month, it won’t be easy.
Another factor is the US Dollar Index (DXY). The index remains indecisive between 100.20 support and 101.80 resistance. However, USD bulls are defending the 100.20 support level we discussed last weekend.
For USDCHF, the bullish invalidation level to watch is the April ascending trend line at 0.8300. If the pair is above that, bulls have a fighting chance.
A sustained high-time-frame break below the 0.8300 region would be bearish. It would also expose recent lows at 0.8210 and 0.8060.
If USDCHF turns bullish from this pattern, key levels and targets are 0.8400, 0.8475, 0.8580, and 0.8730. If buyers get their way, a large buy-side imbalance in the 0.8730 area could serve as a magnet.


