[thrive_custom_box title=”” style=”dark” type=”color” color=”#fef5c4″ border=”fadf98″]
Important: I use New York close charts so that each 24-hour period closes at 5 pm EST.
Click here to get access to the same charts I use.
[/thrive_custom_box]
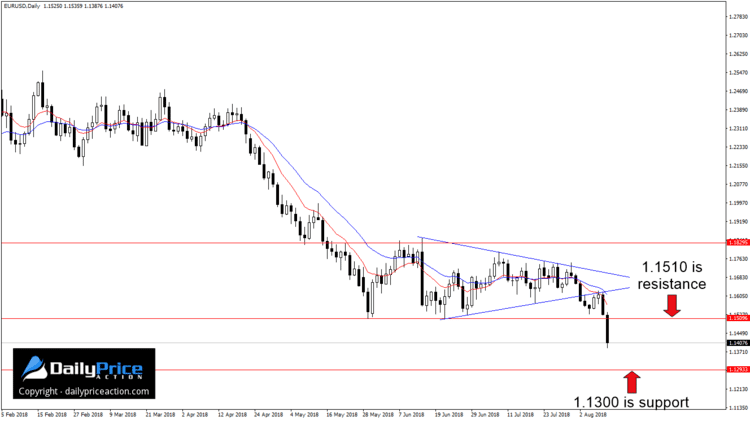
The U.S. dollar made a big push last week, sending the EURUSD and other major currency pairs lower. It also put an end to the range-bound price action that persisted for more than two months.
After retesting former wedge support as new resistance last week, the single currency plummeted more than 200 pips. I first mentioned this continuation pattern on August 2nd and again last weekend, so this was no surprise to readers.
Not only did the EURUSD drop 200 pips in 48 hours, but it also took out range support that had held since late May. As such, any retest of the 1.1510 area this week will likely encounter an influx of selling pressure.
However, given the aggressiveness of Friday’s selloff, I would be a little surprised to see the pair climb that high before the next leg lower. Still, it’s never a good idea to chase a runaway market, plus we have other opportunities to keep us busy.
As I mentioned last week, the 340 pip height of the wedge suggests the next key support comes in just below the 1.1300 handle. The area served as a pivot in June/July of 2017 and is also the November 9, 2016 (U.S. elections) session high.
I remain short here via my entry just above 1.1600 on August 3rd. I’ll be interested in adding to the position this week should we get a rotation higher ahead of a 1.1300 retest.
[thrive_custom_box title=”” style=”dark” type=”color” color=”#fef5c4″ border=”fadf98″]
Want to Learn Step-By-Step How I Swing Trade the Forex Market?
Click Here to Register for the Free Webinar!
[/thrive_custom_box]
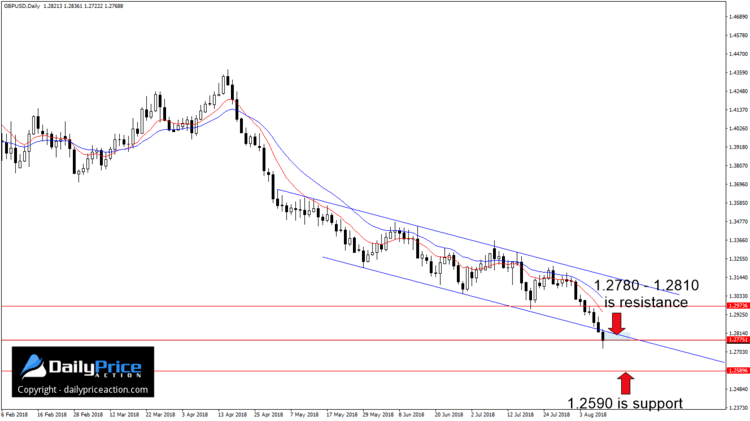
The GBPUSD finally broke free from the descending channel that has directed price action for the past two months. It is unusual to see a downside break of a descending pattern such as this, but apparently the selling pressure was too much for buyers to handle.
While Thursday’s close below channel support is unmistakable, what isn’t as clear is where Friday closed in relation to the 1.2770/80 horizontal area.
If we draw it using the August 2017 low at 1.2773, then Friday’s close of 1.2769 broke the level. But as you may well know, these support and resistance levels are often better thought of as areas rather than exact prices.
However, even if sellers didn’t clear the horizontal level on Friday, they still have to deal with former channel support near 1.2810. As such, any retest of this 1.2780 to 1.2810 area this week will likely be met with selling pressure.
As for key support, we have to look back to the June 2017 low at 1.2590. And based on the dollar strength we saw last week, I don’t anticipate this downtrend will reverse anytime soon.
Only a daily close (New York 5 pm EST) back above former channel support at 1.2810 would negate the bearish outlook.
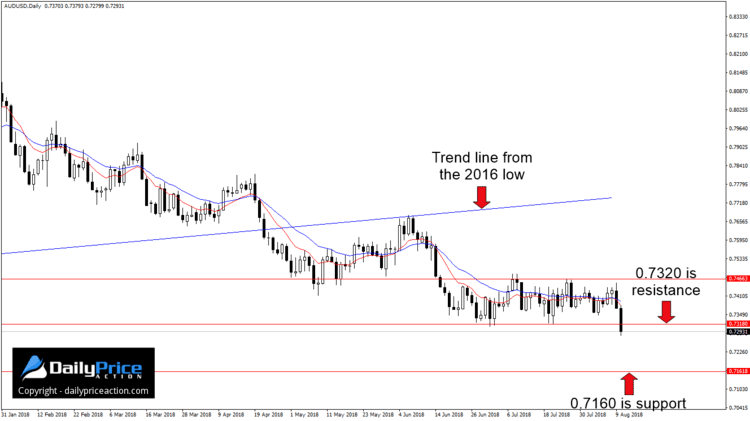
After carving a 140 pip range over the last six weeks, the AUDUSD finally broke down on Friday. The 0.7293 close puts the pair below former range support at 0.7320.
So, just like the EURUSD and GBPUSD above, any retest of support turned resistance should attract sellers. Only a daily close at 5 pm EST (New York close charts) back above 0.7320 would negate the bearish outlook.
You may also recall the retest of the 2016 trend line in early June. I mentioned this retest back on June 7th when the pair was trading 350 pips higher at 0.7646. It seems a simple trend line break has once again signaled a change in trend.
Key support for the week ahead comes in at 0.7160. The area served as support for the AUDUSD in May and December of 2016. It’s also the 2017 low.
Another reason to suspect a move to 0.7160 is the height of the 140 pip range between 0.7320 and 0.7460. Upon breaking out, a market will often traverse a similar distance to that of the former range.
If we measure 140 pips lower from the 0.7320 handle, we get 0.7180 which is just 20 pips shy of the 0.7160 key support I mentioned above.
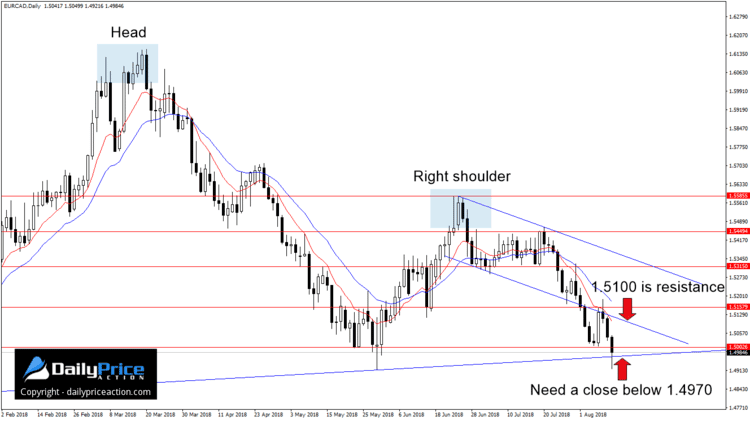
Another pair I’ve had on my radar for some time now is the EURCAD. Apart from selling the EURUSD on August 3rd near 1.1600, the EURCAD is the only pair I’ve traded since late June.
The first entry came back on June 25th at 1.5580 which I announced in the member’s area. I’ve since added to the position at 1.5300 and again this past Wednesday following the rejection from the confluence of resistance at 1.5150.
But if you’re thinking the EURCAD has run its course, you may want to reconsider. A view of the price action since last November shows a pattern similar to that on the GBPCAD. No surprise there given their similarities.
If this is indeed a head and shoulders reversal, it could set the pair on a crash course to the 2016 and 2017 lows near 1.3800.
Now, it’s important to keep in mind that even if the pair does move that far south, it won’t be a smooth ride. There are bound to be several bumps along the way including but not limited to the 1.4740 area and especially the 1.4500 handle.
It also won’t be quick. Even a move to 1.4500 will likely take another month or two to play out, so you can imagine how long it might take for sellers to reach 1.3800.
For now, it’s going to take a daily close (New York 5 pm EST) below neckline support at 1.4970. Without a close below this area, the head and shoulders reversal will have to wait.
As always, there are no guarantees. The above does not mean the EURCAD will drop to 1.3800, 1.4500 or even 1.4740. As traders, the best we can do is determine what’s probable and then establish and follow a game plan that prepares us for every outcome.
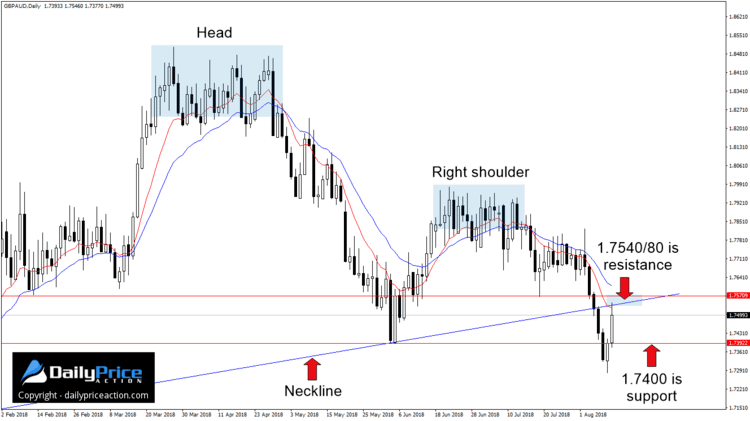
On August 6th I pointed out what could be a 1,200 pip head and shoulders pattern on the GBPAUD. At the time, sellers hadn’t closed the pair below the neckline at 1.7520 which was needed to confirm the reversal pattern.
That confirmation came a few hours after that post. The close on August 6th was marginal at best, but the next 48 hours put those doubts to bed.
After five straight losing days totaling more than 500 pips, the GBPAUD caught a bid on Thursday. And although that session did respect the June low at 1.7400, Friday’s session extended the relief rally by 100 pips.
The late week strength also triggered a retest of the neckline as new resistance. Given the way the pair closed on Friday, I wouldn’t be surprised to see a third push higher.
Another level that could attract sellers is 1.7580. When viewed on the weekly time frame, you’ll notice how this area has influenced the pair’s direction since the May 2017 swing high.
That gives us a confluence of resistance between 1.7540 and 1.7580. Of course, we could see an intraday surge about this area, but as long as it holds on a daily closing basis (New York 5 pm EST), I will remain bearish.
Key support for the week ahead comes in at 1.7400 followed by the year to date low near 1.7100. Only a daily close above the 1.7540/80 area would negate the bearish outlook.
[thrive_custom_box title=”” style=”dark” type=”color” color=”#fef5c4″ border=”fadf98″]
Want to Learn Step-By-Step How I Swing Trade the Forex Market?
Click Here to Register for the Free Webinar!
[/thrive_custom_box]
