[thrive_custom_box title=”” style=”dark” type=”color” color=”#fef5c4″ border=”fadf98″]
Important: I use New York close charts. Click Here to Use My Preferred Broker
[/thrive_custom_box]
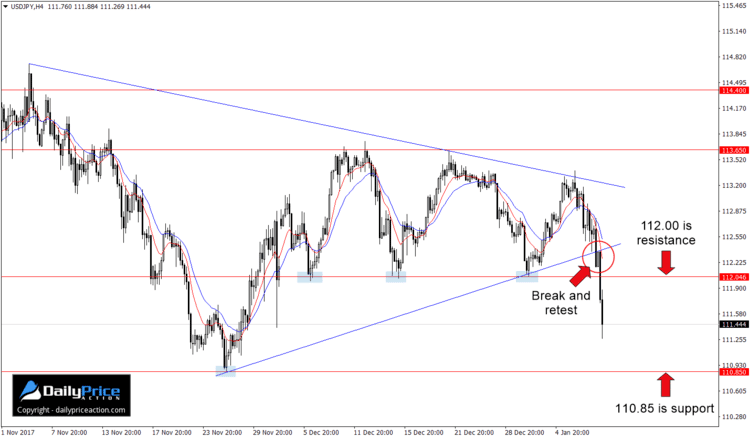
Just 24 hours ago the USDJPY was consolidating within a wedge pattern that began in late November of last year. Given the terminal nature of the consolidation, we were waiting for a breakout over the coming sessions.
One thing I mentioned yesterday is that I might drop to the 4-hour time frame following a break. As you can see from the chart below, that turned out to be a good move.
Shortly after breaking wedge support during the Tokyo session, the USDJPY retested 112.35 as new resistance. If you recall from Tuesday’s commentary, the area in question was between 112.30 and 112.40.
The result was a 108 pip selloff in just seven hours. With prices now hovering between 110.85 support and 112.00 resistance, it’s a question of which level will be tested first.
If we get a move back toward the 112.00 area before 110.85, I will be on the lookout for bearish price action. And with 115 pips between the two levels, there’s plenty of real estate.
But even if sellers force a 110.85 print first, it doesn’t mean the bearish idea is off the table. It just means we have to be more cautious considering how significant the 110.85 area was throughout 2017.
For now, I’m only interested in short opportunities here. Given today’s break of wedge support followed by the 112.00 handle, there isn’t much doubt that sellers are in control.
[thrive_custom_box title=”” style=”dark” type=”color” color=”#fef5c4″ border=”fadf98″]
Want to see how we’re trading this? Click Here to Join Justin and Save 70%
[/thrive_custom_box]


