[thrive_custom_box title=”” style=”dark” type=”color” color=”#fef5c4″ border=”fadf98″]
Important: I use New York close charts. Click Here to Use My Preferred Broker
[/thrive_custom_box]
We discussed the EURUSD on Thursday less than 24 hours ahead of Friday’s non-farm payroll. While the event didn’t stir the kind of volatility we’re used to seeing, the pair did encounter selling pressure at a suspected level.
The 1.2070 area was responsible for capping the late August and early September advance in 2017. So much so that sellers carved two bearish pin bars on August 29 and September 8. The latter triggered a 540 pip decline over the next eight weeks.
As long as 1.2070 holds as resistance on a daily closing basis (5 pm EST), the 1.1940 support level is exposed. However, if buyers manage to break 1.2070, there’s a confluence of resistance at 1.2140/50 that could come into play.
If you scroll back on the weekly chart to May and June of 2010, you’ll notice several weekly lows at 1.2140/50. We’ll see whether or not those lows combined with channel resistance (see chart below) become a factor over the coming sessions.
Another consideration I mentioned on Thursday is the fact that prices are currently 200 pips above the weekly mean as measured by the 10 and 20 EMAs. That’s a considerable distance and one that doesn’t usually last long.
Keep all that in mind if you’re long the EURUSD. Gains are still possible up here, but if buyers intend to sustain a break above the 2017 high, a pullback or at least some consolidation may be needed first.

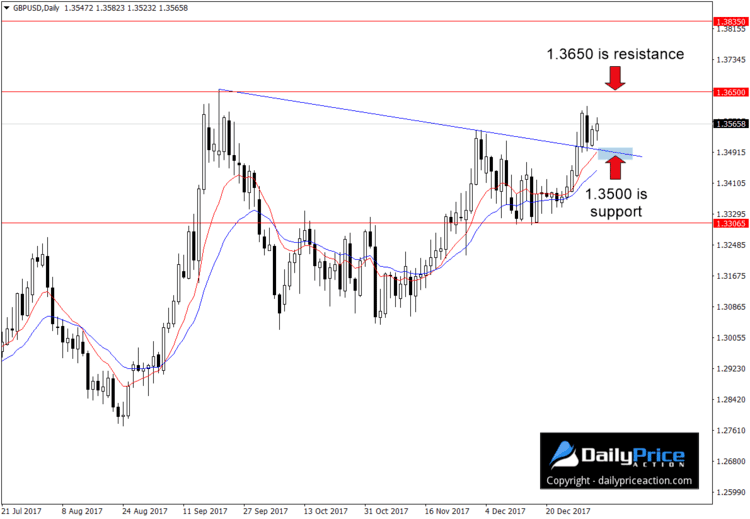
On Tuesday of last week, the GBPUSD closed above recent highs at 1.3545. I was looking for the level to serve as support during Wednesday’s retest, but sellers had other plans. No harm was done as there was never a signal to go long.
Another look at the GBPUSD over the weekend shows a trend line that came into play last week. The level that extends from the 2017 high of 1.3657 appears to have attracted a bid during last week’s pullback.
As long as this level holds as support on a daily closing basis, the 2017 high remains exposed. Of course, last Wednesday’s high at 1.3613 could also attract a few offers on the way up.
A daily close at 5 pm EST above the 1.3650 area would expose the next key resistance at 1.3835. The level held as the 2016 low until the June Brexit.
Alternatively, a daily close below trend line support between 1.3490 and 1.3500 would negate the bullish outlook.

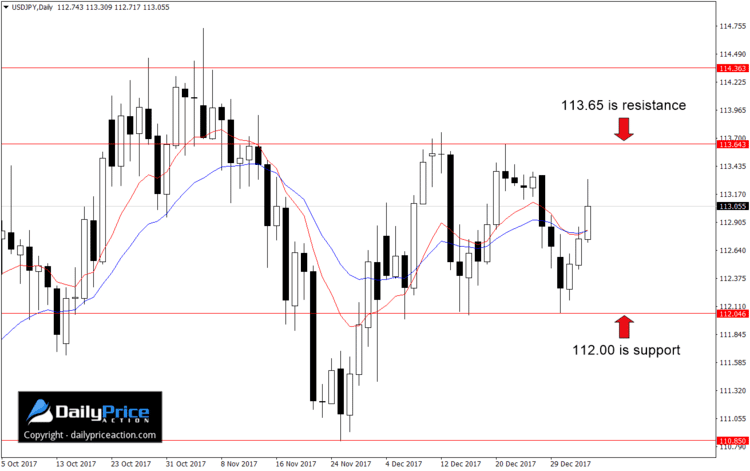
The USDJPY has been relatively idle in recent weeks. Price had been moving within a 600 pip range between April and November of last year, but since then consolidation has taken over.
Although recent price action looks a bit messy, there is a narrow range that could produce a breakout over the coming sessions.
The area between 112.00 support and 113.65 resistance is one to keep an eye on in my opinion. A daily close below 112.00 would expose the November 2017 low at 110.85 while a close above resistance would target the multi-month range top at 114.40.
That said, given the lack of volume this time of year I won’t consider an entry in either scenario without a price action signal.
Traders can also play the current 160 pip range. Bearish price action from 113.65 would suggest a move lower while bullish price action from the 112.00 area would signal a turn back toward the range ceiling.
[thrive_custom_box title=”” style=”dark” type=”color” color=”#fef5c4″ border=”fadf98″]
Get Free Forex Trade Setups Delivered To Facebook Messenger! Tap Below.
[/thrive_custom_box]

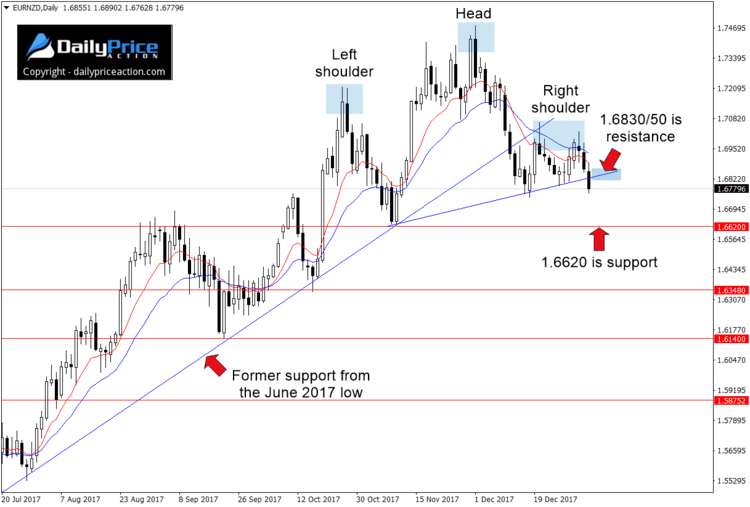
EURNZD sellers confirmed what could be a 760 pip reversal on Friday. We’ve discussed the potential of a head and shoulders pattern here since December 28.
In fact, it was one month ago on December 6 that I first mentioned the idea that the EURNZD rally was coming to an end. A few days later it became my top trade idea for the new year.
Friday’s 1.6780 close puts the pair well below former neckline support near 1.6830/50. As such, any retest of the area as new resistance should attract an influx of selling pressure.
Per Thursday’s commentary, the objective for the pattern comes in at 1.6140. This area served as support in September of last year. To be more precise, a measurement of 760 pips from the neckline targets the 1.6070 area, but 1.6140 would be a more conservative target.
However, there’s no guarantee the pair will ever see either of those levels. In truth, there’s no guarantee that former neckline support will hold as new resistance this week. But as long as 1.6830/50 does hold as resistance on a daily closing basis, the bearish reversal pattern is in play.
The first key support sellers will have to deal with comes in at 1.6620. A daily close (New York 5 pm EST) below that would expose the next critical area at 1.6350 followed by the objective between 1.6070 and 1.6140.
Alternatively, a daily close back above former support near 1.6850 would negate the bearish outlook.

Similar to the EURNZD, the EURAUD looks top heavy. I mentioned the pair on December 22 as one to watch in 2018.
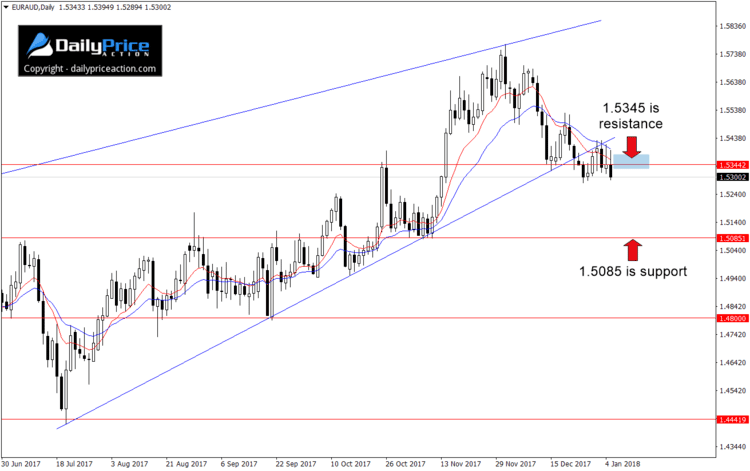
Last week’s retest of former trend line support as new resistance was spot on. Sellers came out in force just above 1.5400 and subsequently closed the pair below the 1.5345 area.
I suspect sellers will want to defend the 1.5345 area this week should it come under fire as new resistance. But as long as the EURAUD remains below former trend line support, the 1.5085 area is exposed.
A daily close below that at 5 pm EST would target the September 2017 low at 1.4800 followed by the July 2017 low at 1.4440.
Bear in mind that the EURAUD and EURNZD often move in tandem. So if you trade both without modifying your position size, you could expose yourself to unnecessary risk.
[thrive_custom_box title=”” style=”dark” type=”color” color=”#fef5c4″ border=”fadf98″]
Want to see how we’re trading these? Click Here to Join Justin and Save 70%
[/thrive_custom_box]


