[thrive_custom_box title=”” style=”dark” type=”color” color=”#fef5c4″ border=”fadf98″]
Important: I use New York close charts. Click Here to Use My Preferred Broker
[/thrive_custom_box]
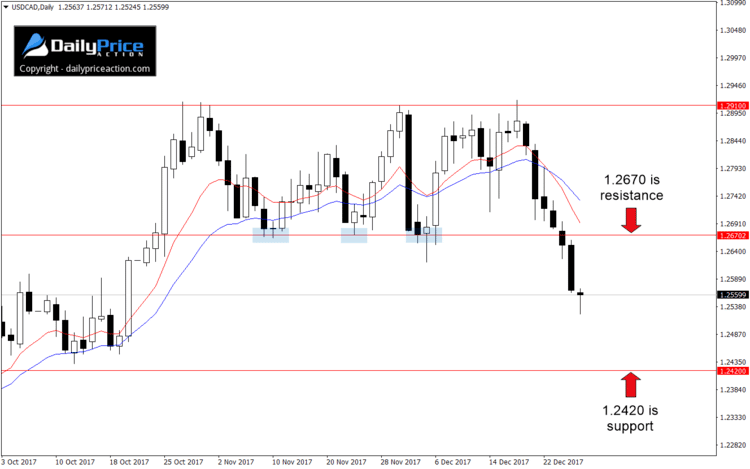
The USDCAD hasn’t disappointed those who went short earlier this week. Since Wednesday’s sub 1.2670 close, the pair is down more than 100 pips.
Unfortunately, we never did get a retest of the 1.2670 area as new resistance. Seeing as how I don’t like to chase a market, I didn’t sell the USDCAD. But that doesn’t mean I won’t get an opportunity next week.
While there’s no guarantee that prices will return to 1.2670 before reaching 1.2420 support, the pair is quite overextended. It’s a suggestion that offers could begin to dry up momentarily.
I use the 10 and 20 exponential moving averages (EMAs) as a mean reversion tool. When the price moves too far away from them on the daily chart, a retracement of some sort usually isn’t far away.
At the moment there are approximately 160 pips between today’s price and the 10 and 20 EMAs. That’s a significant distance for the USDCAD and one that doesn’t tend to last long.
Another consideration is the fact that today would be the seventh straight down day. The last time that happened was in August of 2016. After nine consecutive losing sessions, the pair went on to rally 800 pips.
Now, I don’t expect the USDCAD to rally here. Wednesday’s break of two-month range support appears significant, and the 1.2420 support area remains a target.
However, the overextension to the downside and six-day losing streak (perhaps seven) do suggest a retracement is in order. I could be wrong on that, but markets don’t often stray this far from the mean for more than a few days at a time.
I’m going to remain on the sideline for now. A retest of 1.2670 as new resistance would help ‘reset’ prices and could provide a favorable opportunity to get short next week. Key support remains the late July lows at 1.2420.
Alternatively, a daily close (5 pm EST) back above 1.2670 would negate the bearish outlook. It would also re-expose the former range ceiling at 1.2910.
[thrive_custom_box title=”” style=”dark” type=”color” color=”#fef5c4″ border=”fadf98″]
Want to see how we’re trading this? Click Here to Join Justin and Save 70%
[/thrive_custom_box]


